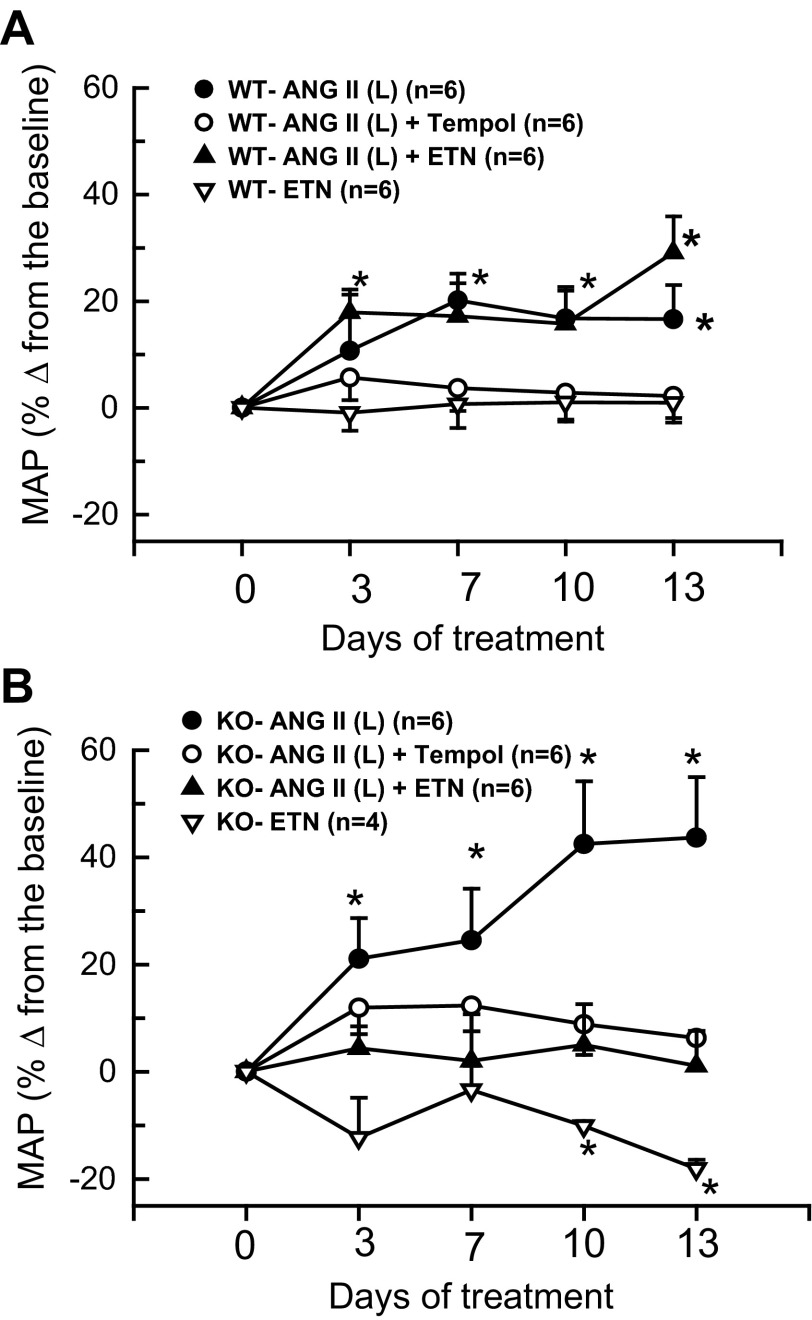
Fig. 5.
Percent changes in mean arterial pressure (MAP) from corresponding baseline values in WT (wild type; A) and KO (eNOS knockout; B) mice treated with ANG II (L) (10 ng/min), tempol and etanercept (ETN) recorded by tail-cuff plethysmography. *P < 0.05 vs. corresponding baseline values prior to the start of drug treatment (at −1 day).

