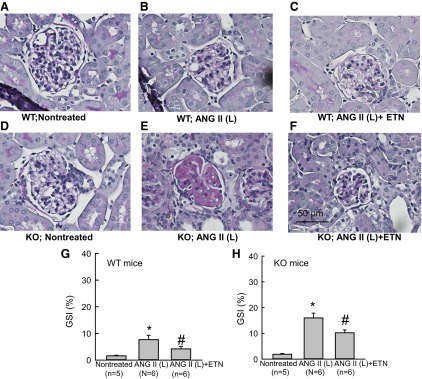
Fig. 6.

A–F: representative samples of PAS staining of the renal sections collected from WT and KO mice treated with ANG II (L) (10 ng/min). Microphotograph was taken using a 40× objective (Nikon Eclipse 50i), and images were captured with a digital camera (Nikon DS-Fil). G and H: mean value of glomerulosclerosis index (GSI) determined from PAS staining of the renal sections collected from WT (G) and KO (25 ng/min) mice. *P < 0.05 vs. corresponding nontreated group. #P < 0.05 vs. ANG II-treated group.
