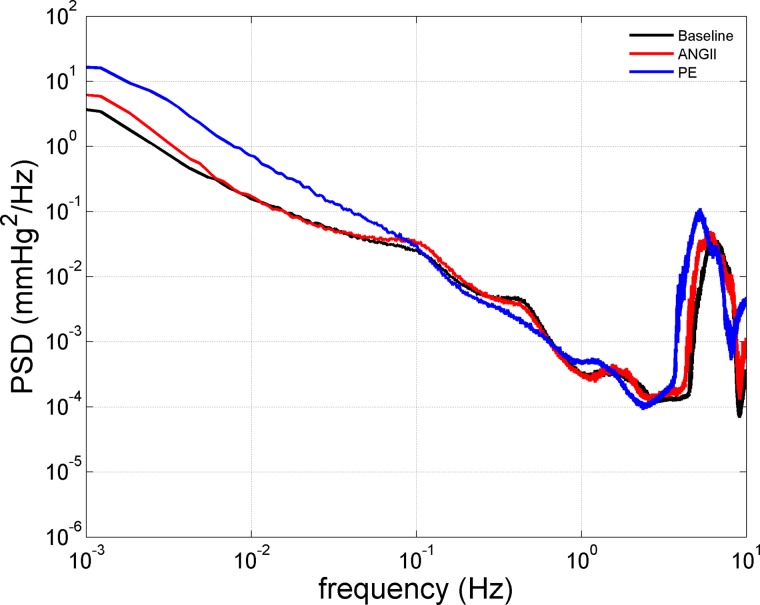
Fig. 1.
Computed 24-h ambient blood pressure (BP) power spectral density [PSD, (mmHg)2/Hz] at baseline (n = 15) and during ANG II (ANG II; n = 7) and phenylephrine (PE; n = 8) administration. Because no significant differences were observed with respect to the BP PSD obtained during baseline recordings, these data have been averaged between groups for presentation clarity. Significant differences in the effects of ANG II and PE were observed at several different frequency ranges of the 24 h. BP spectra (see Table 1 for details).

