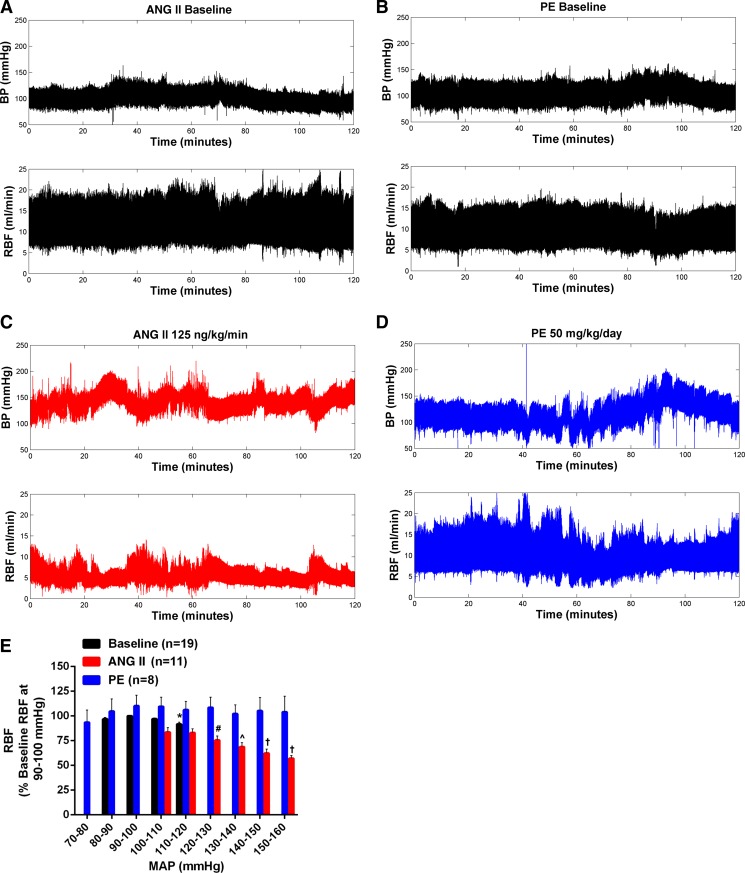
Fig. 4.
Effects of ANG II and PE on BP-RBF relationships in conscious chronically instrumented rats. Representative BP-RBF recordings at baseline (A and B) and during ANG II (C) or PE (D). When expressed as % change from RBF when BP was within 90–100 mmHg (E), only ANG II led to marked reductions in RBF during episodes of BP elevations. No differences were seen in BP-RBF relationships during baseline recordings in both groups so these data have been averaged. Values are expressed as means ± SE. *P < 0.05 vs. respective RBF at baseline BP (90–100 mmHg). #P < 0.05 vs. respective RBF at 100–110- and 110–120-mmHg BP bins. ^P < 0.05 vs. respective RBF at 100–110-, 110–120-, and 120–130-mmHg BP bins. †P < 0.05 vs. respective RBF at 100–110-, 110–120-, 120–130-, and 130–140-mmHg BP bins.

