
Figure 4.
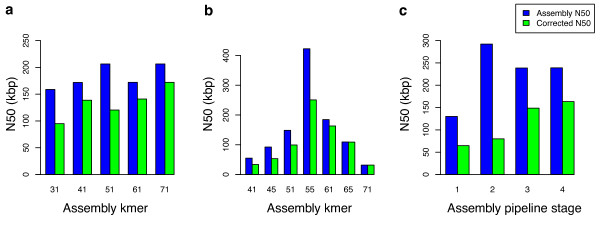
N50 statistics of various assemblies before and after correcting with REAPR. Blue bars show the N50 of the assembly input to REAPR, green bars show the corrected N50. (a) De novo assemblies of S. aureus. (b) P. falciparum de novo assemblies. (c) B. pahangi assemblies at four different stages of the genome project (see Additional file 1 for details).