
Fig. 2.
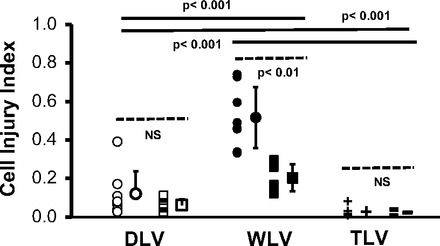
A comparison of hyperventilation-induced epithelial injury estimates between “dry” lungs (DLV), “wet” lungs, i.e., partially liquid-flooded lungs (WLV), and completely saline-filled lungs subjected to total liquid ventilation (TLV) is shown. The two DLV groups (open symbols) differ with respect to positive end-expiratory pressure and tidal volume settings. Open circles represent data from lungs ventilated between zero end-expiratory pressure and 40 cmH2O pressure. The open squares represent data from lungs ventilated between 3 and 40 cmH2O pressure. The two WLV groups differ with respect to the biophysical properties of the alveolar liquid. Closed circles represent data from partially saline-filled lungs. Closed squares represent data from partially perfluorocarbon-filled lungs. The two TLV groups differ with respect to the duration of mechanical ventilation. Crosses represent data from lungs that were ventilated for 20 min. Bars represent data from lungs that were ventilated for 60 min. Cell injury index (CII) refers to the number of wounded epithelial cells per alveolus in post hoc-labeled lungs. Individual and group mean values and their SDs are shown. Dashed and solid lines identify the groups to which statistical comparisons of data means apply. NS stands for not significant at a P value <0.05.