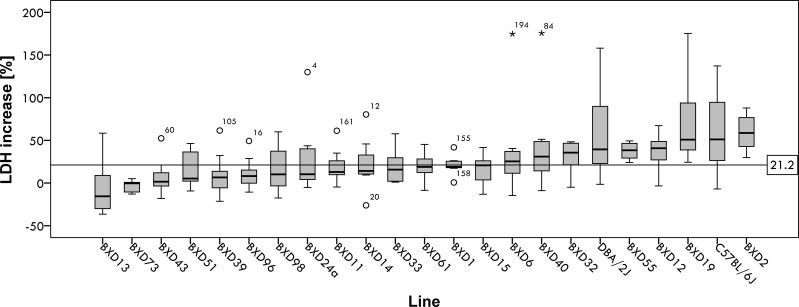
Fig. 1.
Distribution of hepatocellular damage increase in vitro [percentage increase in lactate dehydrogenase (LDH) release between untreated hepatocytes and transforming growth factor (TGF)-β-treated hepatocytes] in response to TGF-β in all BXD lines assayed (∑ = 199, medians ± 95% confidence interval), in ascending order. The horizontal line at 21.2% shows the mean increase for all samples assayed. Boxes represent the interquartile range (IQR = 25th percentile to the 75th percentile); bold horizontal line represents the median value. Whiskers or inner fences represent 1.5 times the IQR or, if no case has a value in that range, to the minimum or maximum values. If the data are distributed normally, ∼95% of the data are expected to lie between the inner fences. Circular dots represent outliers which differ from the mean by >1.5 times the IQR. *Extreme outliers that differ from the mean by >3 times the IQR.

