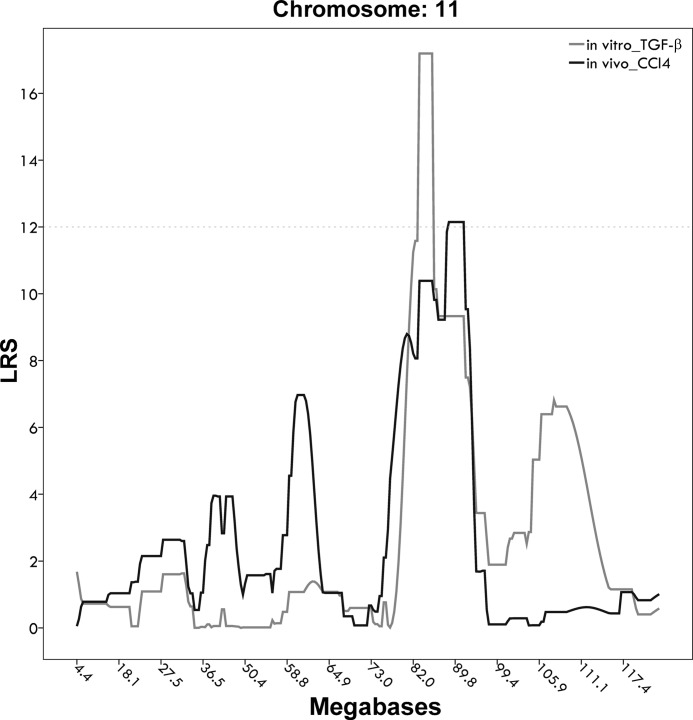
Fig. 3.
Superimposed quantitative trait locus peaks for in vivo fibrosis stages following carbon tetrachloride (CCl4) challenge and in vitro LDH increase following TGF-β treatment. The x-axis shows the megabase position on mouse chromosome 11; the y-axis shows LRS values for the respective traits. Hepatocyte susceptibility to TGF-β-mediated damage is shown in light gray; F-score following CCl4 injection is shown in dark gray.

