
Fig. 4.
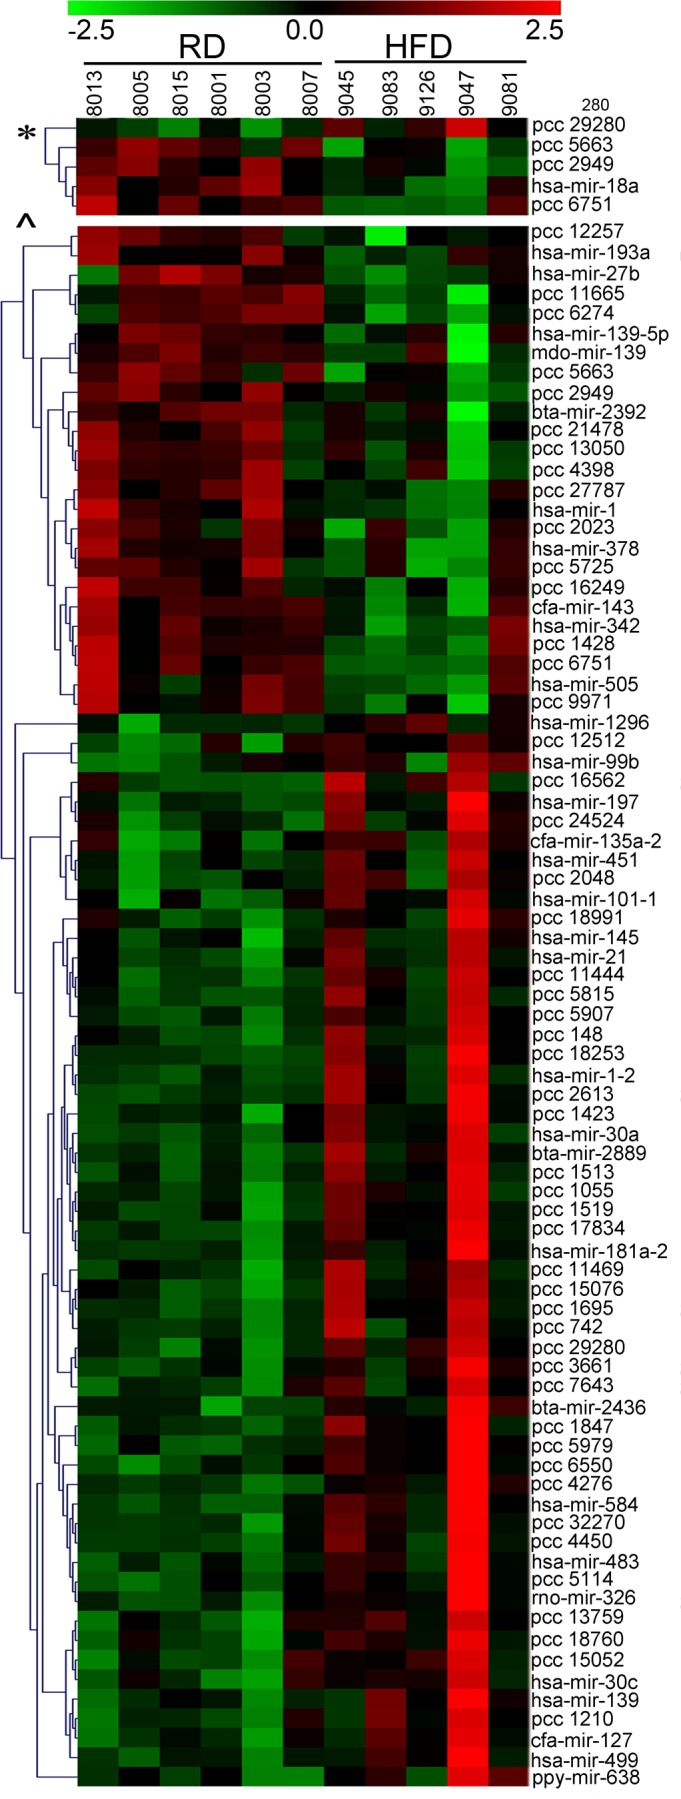
Hierarchical clustering of differentially expressed miRNAs. Heat maps of the known and novel (PCC) miRNA microarray data showing the normalized log2 miRNA expression level for each miRNA (rows) in each sample (columns) for P < 0.001 (top) and P < 0.05 (bottom), according to the indicated color scale. Red indicates overexpression; green represents downregulation.