
Fig. 3.
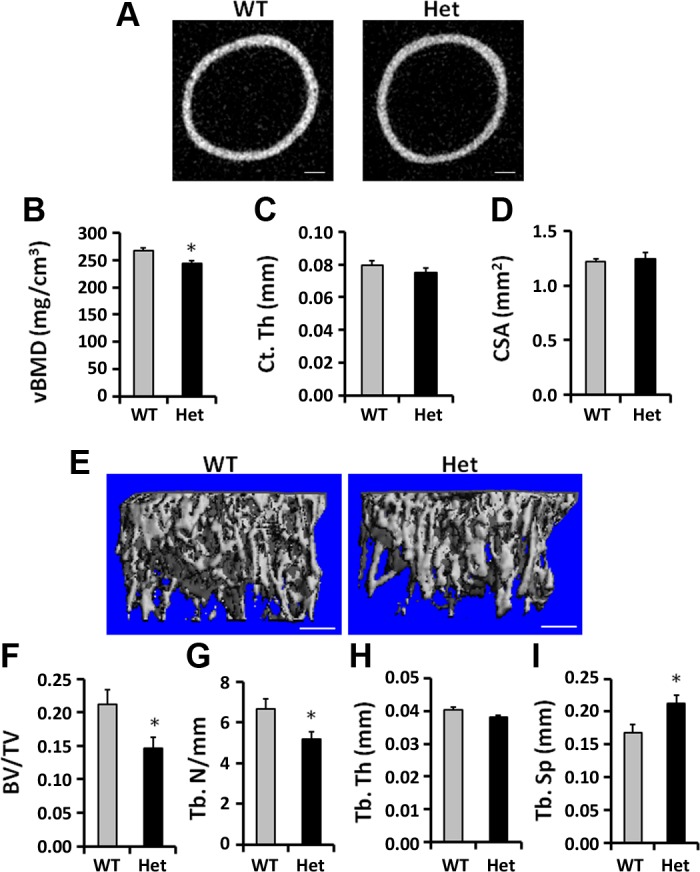
Femur cortical and trabecular bone microarchitecture in 3 wk old WT and Het mice. A: cross-sectional images of the femurs at the middiaphysis in the WT and Het mice. B: microcomputed tomography (μCT) of the femur middiaphysis showed reduced volumetric (v) BMD. C, D: cortical thickness (Ct. Th) and cross-sectional area (CSA) of the femur middiaphysis were not significantly altered in the Het mice compared with WT mice. E: the 3D rendering of the trabecular bone at the distal femur of WT and Het mice exhibited reduced trabecular bone architecture in the Het mice compared with WT mice. F–I: bone volume to total volume (BV/TV) and trabecular number (Tb. N) were reduced, while trabecular separation (Tb. Sp) was increased in the Het mice compared with WT mice. Tb. Th, trabecular thickness. *P < 0.05, n = 10/group. Data are presented as means ± SE. Bar = 200 μm.