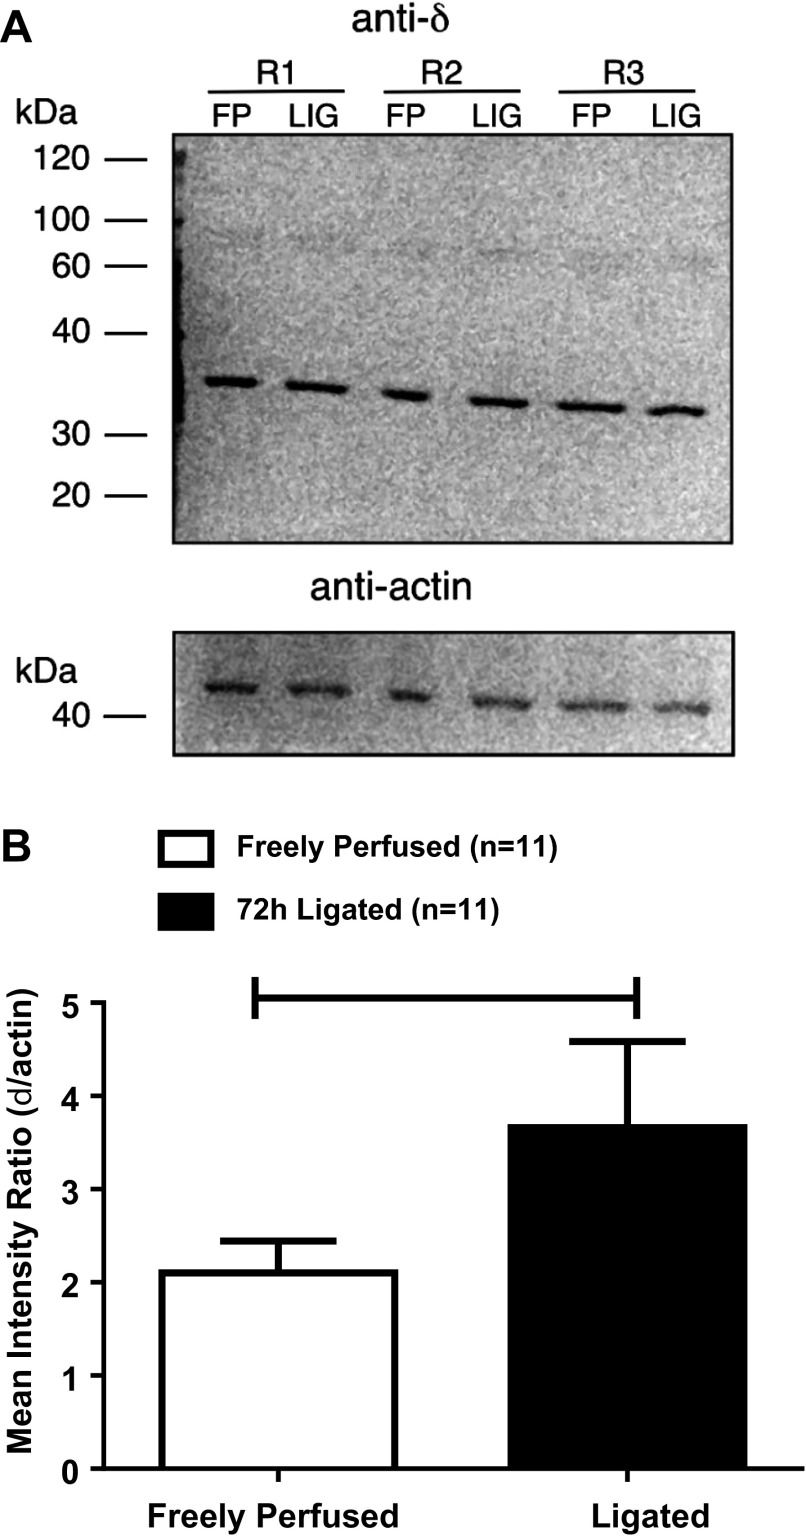
Fig. 8.
A: Western blot illustrating results with anti-δ-opioid receptor and anti-actin in DRG tissue isolated from three rats with freely perfused (FP) and ligated (LIG) femoral arteries. Each lane was loaded with ∼25 μg of protein corresponding to each rat's DRG tissue. Lines indicate approximate molecular weights (kDa). B: densitometric analysis of Western blots for δ-opioid receptor and actin quantified by measuring the area density (i.e., intensity). The plot illustrates the mean ratio of each receptor value normalized to its respective actin value. Horizontal brackets signify that the intensities were significantly different from each other (P < 0.05).

