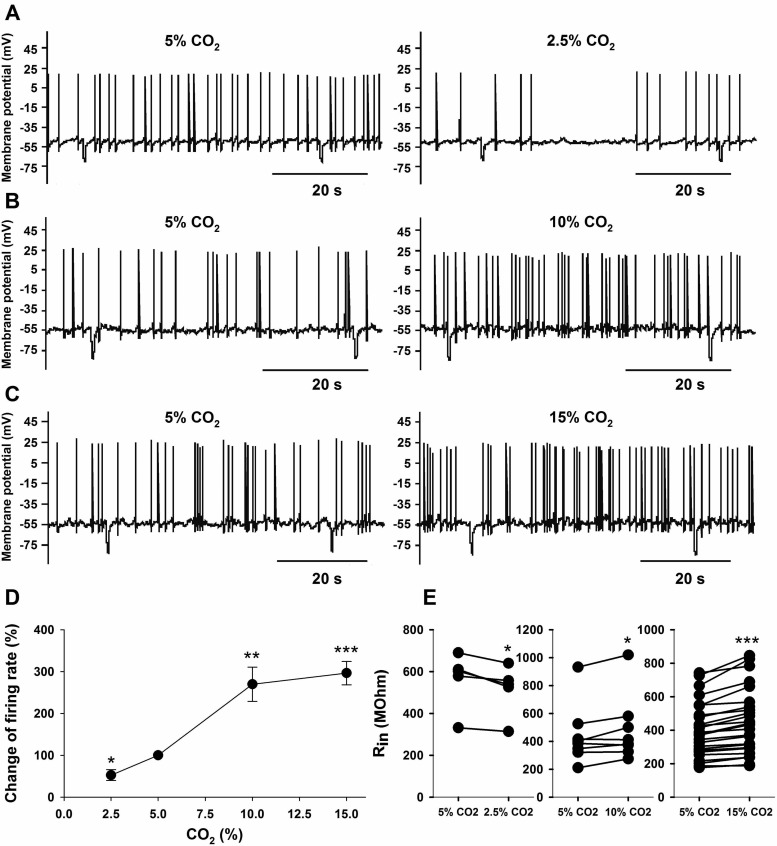
Fig. 1.
The effects of hypocapnia and hypercapnia on the spontaneous firing rate and input resistance in locus coeruleus (LC) neurons. A: traces of membrane potential (Vm) vs. time showing action potential frequency. Compared with control (5% CO2), firing rate went down in 2.5% CO2. B: compared with control, firing rate increased in 10% CO2. C: compared with control, firing rate increased in 15% CO2. D: relationship between the CO2 and the change in firing rate induced by different levels of CO2 in LC neurons. The response is presented as the percentage of change of firing rate in altered CO2 vs. control (5% CO2). Symbols represent the mean changes in firing rate ± SE. Note the large effect of CO2 on firing rate between 2.5 and 10% but the plateau of firing rate above 10% CO2. The % change in firing rates at various levels of CO2 were significant at *P < 0.05, **P < 0.01, or ***P < 0.001. E: effect of CO2 on input resistance (Rin). The response is plotted as paired data for Rin at 5% CO2 vs. 2.5%, 10%, or 15% CO2. Each pair shows the response of Rin for a given neuron in response to the indicated change of CO2. Rin is significantly different from the values at 5% CO2 at either *P < 0.05 or ***P < 0.001 based on paired t-tests.

