Fig. 3.
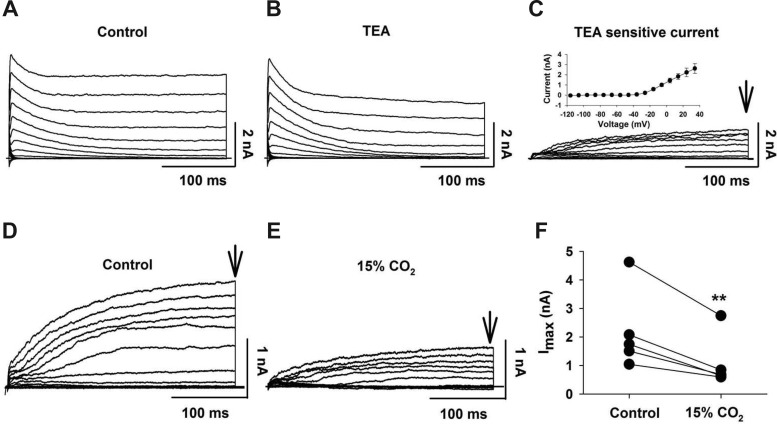
TEA-sensitive outwardly rectifying K+ current in LC neurons. A: representative family of outwardly rectifying K+ currents elicited by command pulses (300-ms duration) from −116 to +34 mV with 10-mV increments; Vh = −96 mV. B: representative family of outwardly rectifying K+ currents elicited by the same command pulses in the presence of TEA (20 mM). C: representative family of TEA-sensitive outwardly rectifying K+ currents was obtained by subtracting the currents in B from those in A. Arrow shows time at which the current amplitude was quantified. Inset: activation current-voltage (I-V) plot for TEA-sensitive outwardly rectifying K+ current (n = 4). Symbols represent means ± SE. D: representative family of TEA-sensitive outwardly rectifying K+ currents. E: family of TEA-sensitive outwardly rectifying K+ currents from the same neuron as in D but in the presence of 15% CO2. Note the markedly smaller currents in the hypercapnic solution. F: LC neurons showing paired currents for each neuron in control (5% CO2) and in 15% CO2. Currents were quantified at the points indicated by the vertical arrows in D and F. Note that 15% CO2 significantly (**P < 0.01) reduced the TEA-sensitive outwardly rectifying K+ current.

