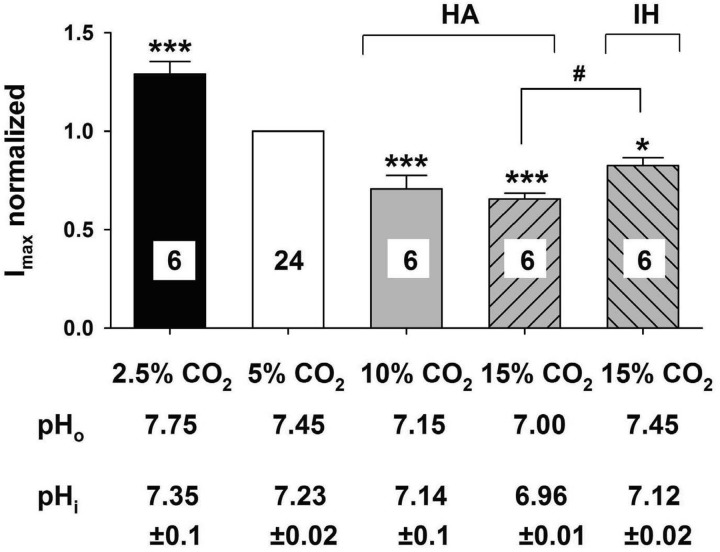
Fig. 6.
Summary of the effects of hypercapnia and hypocapnia on the transient A current in LC neurons. The transient A currents in various levels of CO2 were expressed as a function of the maximum current at 5% CO2. Each bar represents the mean ± SE for the maximum transient A current in 2.5% (black bar), 5% (white bar), 10% (gray bar), 15% HA (upward hatched bar) CO2 and 15% isohydric hypercapnia (IH) solution (downward hatched bar). The number of neurons is given in each bar. For each level of CO2, the maximum transient A current was significantly different than in 5% CO2 (***P < 0.001) and 15% CO2-IH was also significantly different than in 5% CO2 (*P < 0.05). Further, the maximum transient A current was significantly smaller in 15% CO2-HA vs. 15% CO2-IH (#P < 0.05). Below each bar is the value of pHo measured for aCSF equilibrated with the corresponding value of CO2 and of the mean ± SE of the pHi measured using pyranine fluorescence in LC neurons exposed to aCSF equilibrated with the corresponding level of CO2.

