
Fig. 2.
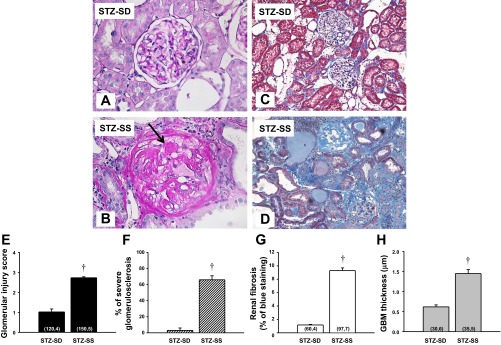
Comparison of the renal histopathology: Periodic acid-Schiff (PAS) staining (A and B), Masson's trichrome (C and D), glomerular injury score (E), percentage of severe glomerulosclerosis (F), renal fibrosis (G), and glomerular membrane thickness (GBM; H) in STZ (50 mg/kg ip)-treated SD and Dahl SS rats with a low dose of insulin (2 U/day sc) after 12 wk of diabetes. Arrow indicates areas of glomerular nodule formation. Numbers in parentheses indicate the number of glomeruli and rats studied per group. Values are expressed as means ± SE. †Significant difference from the corresponding value in STZ-SD rats at the same time period.