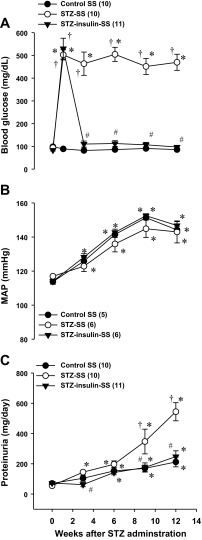
Fig. 3.
Comparison of blood glucose levels (A), mean arterial pressure (MAP; B), and proteinuria (C) in control and STZ (50 mg/kg ip)-treated Dahl SS rats with either a low-dose (2 U/day sc, STZ-SS) or therapeutic dose (4 U/day sc, STZ-insulin-SS) of insulin during 12 wk of diabetes. Numbers in parenthesis indicate the number of rats studied per group. Values are expressed as means ± SE. *Significant difference from the corresponding value within the same strain at week 0; †Significant difference from the corresponding value in control SS rats at the same time period. #Significant difference from the corresponding value in STZ-SS rats at the same time period.

