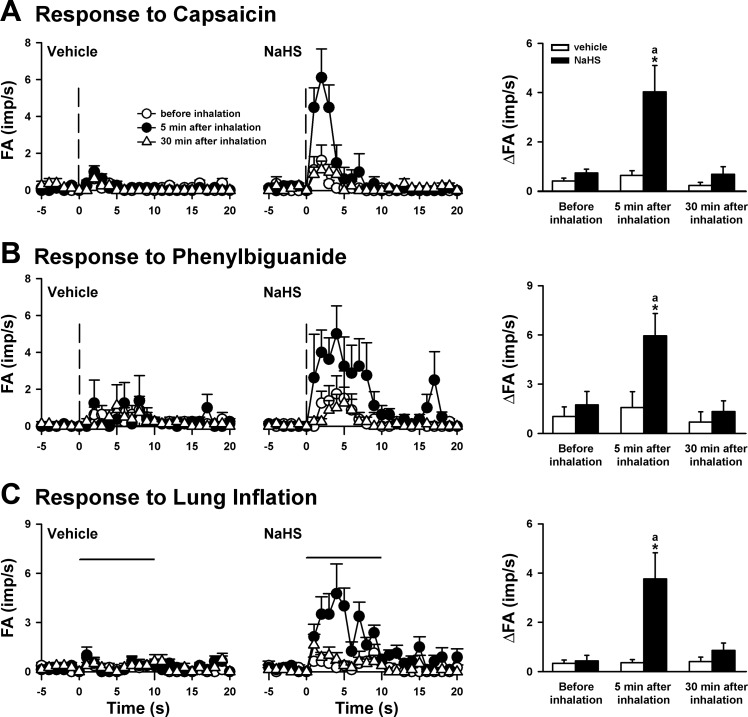
Fig. 2.
The afferent responses of CSLV fibers to the right atrial bolus injection of capsaicin (A) and phenylbiguanide (B) and to lung inflation (C) before and 5 and 30 min after the termination of airway exposure to aerosol in 3 groups of rats. Middle and left: average afferent responses at groups of inhalation of NaHS aerosol (5 mg/ml, 3 min) and its vehicle (saline), respectively. Vertical dashed lines in A and B are the onset time of the right atrial injection of capsaicin (0.5–1.0 μg/kg) and phenylbiguanide (3–8 μg/kg), respectively. The horizontal lines in C are the duration of lung inflation (Ptr = 30 cmH2O, 10 s). FA, fiber activity; imp, impulses. Right: average peak afferent responses to inhalation of NaHS aerosol and its vehicle (saline). In A and B: the increase in fiber activity (ΔFA) was measured as the difference between peak FA (averaged over 3-s intervals) and baseline FA in each fiber. In C: ΔFA was measured as the difference between the peak FA (averaged over a 5-s interval) during inflation and the baseline FA. aSignificantly different from the value before inhalation in the same group (P < 0.05). *Significantly different from the value at the corresponding time period in the vehicle group (P < 0.05). Data in each group are means ± SE of 8 fibers recorded from 8 rats.

