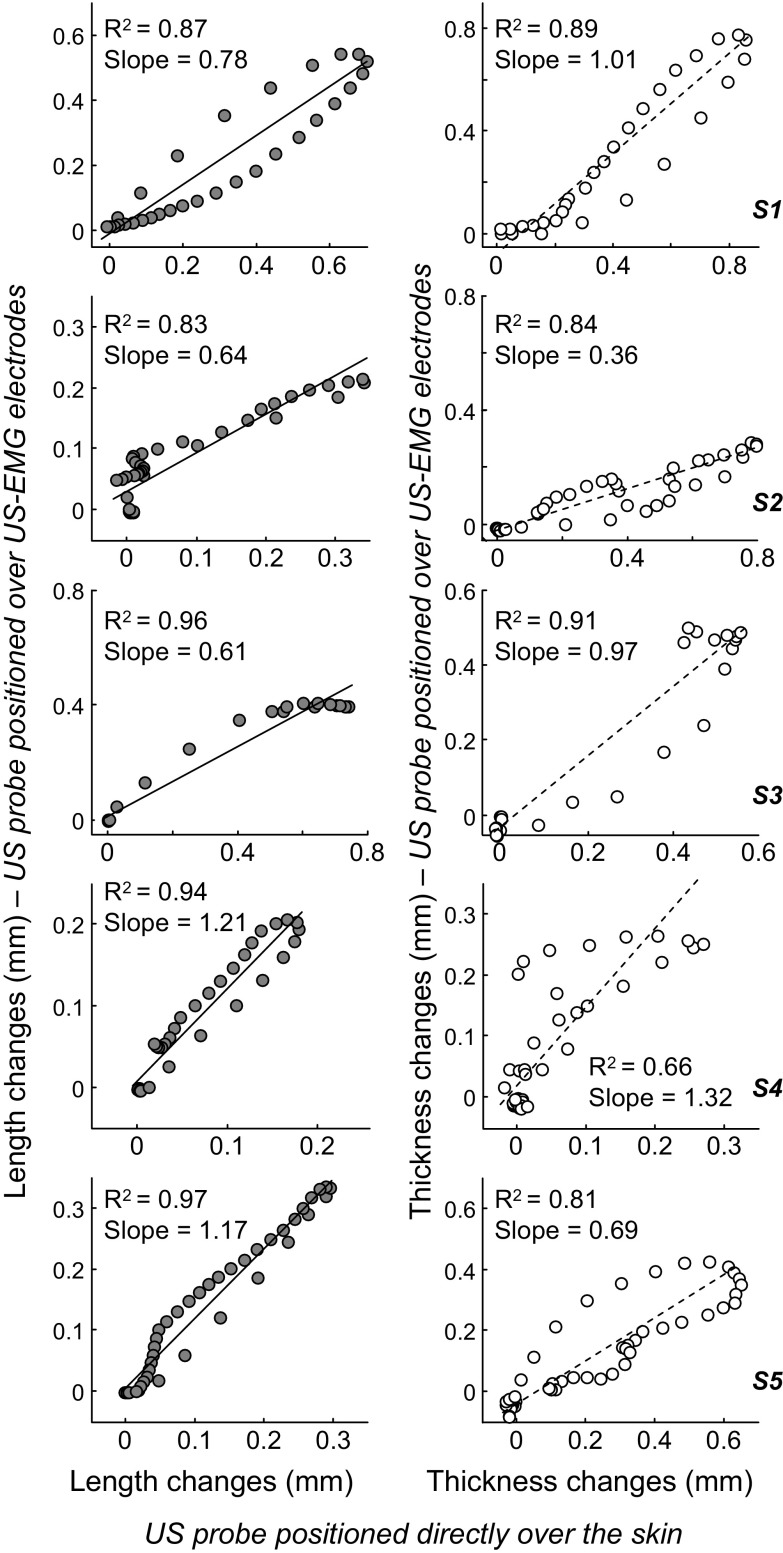
Fig. 6.
Effect of the US-EMG electrodes on electrically elicited changes in muscle shape. Scatter plots created from twitches averaged across 10 stimuli are shown for each participant. Values obtained with the US probe positioned over our US-EMG electrodes are shown in the ordinate, whereas those obtained with the US probe lying over the skin are shown in the abscissa. Estimated changes in medial gastrocnemius length and thickness are shown in the left column (shaded circles) and right column (open circle), respectively. Pearson coefficient of determination (R2), and the slope of the regression lines are reported within each scatter plot. Data from one participant were excluded from this analysis because the trigger signal was not sampled with the US images.

