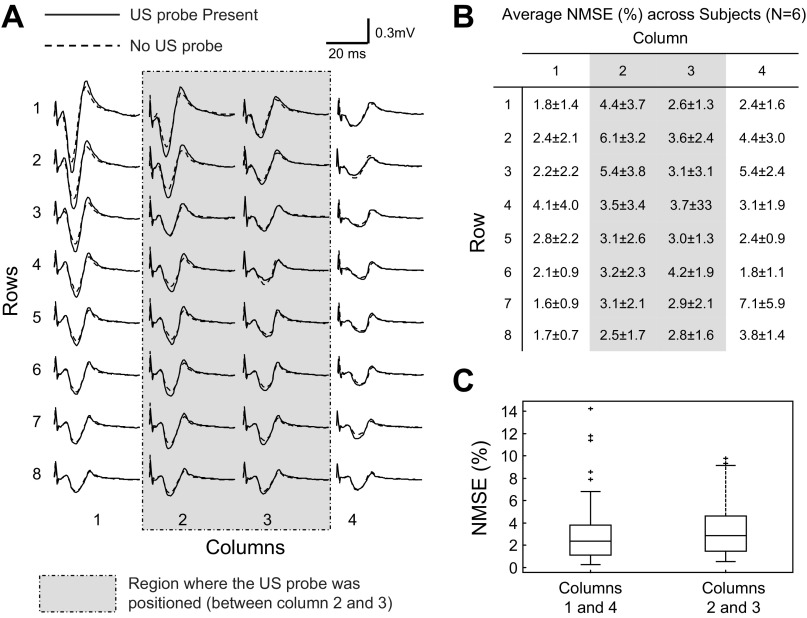
Fig. 7.
Effect of the US probe on M-wave waveform. A: monopolar M-waves detected from the 32 electrodes of the ultrasound matrix in one representative subject. For each electrode, two signals are reported: M-wave detected with (trial 2, solid line) and without (trial 1, dashed line) the US probe lying over the matrix. The shaded rectangle represents the region within which the US probe was positioned (between columns 2 and 3). B: average normalized mean square error (NMSE) between M-waves acquired with and without ultrasound probe lying over US-EMG electrodes (see Fig. 2). For each channel, NMSE was computed according to Eq. 1 and averaged across six subjects. C: NMSE values for the lateral (1 and 4) and central (2 and 3) columns of electrodes are shown (N = 6 subjects × 16 electrodes × 2 pairs of columns), with columns 2 and 3 being closest to the US probe. Horizontal lines denote the median values, whereas boxes indicate the interquartile intervals and whiskers correspond to the non-outlier intervals.

