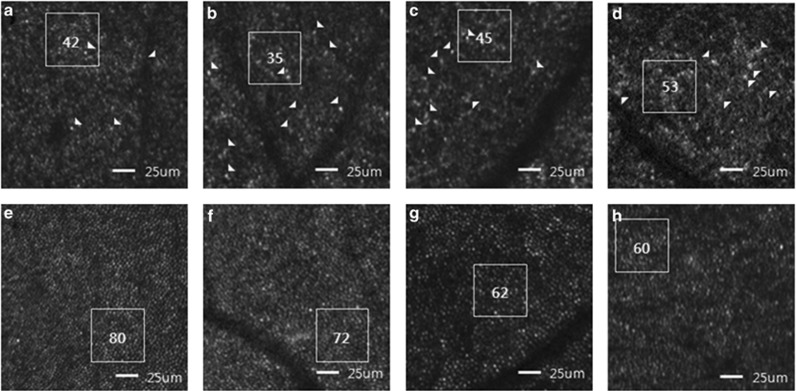
Figure 4.
AO-SLO images of carriers of XLRP and controls. Manual counting of the number of cone cells was performed within the area indicated by white box. Some morphologically large and/or abnormal cone cells are indicated by arrowheads. (a) AO-SLO image of subject 2 (temporal 0.5 mm). (b) AO-SLO image of subject 3 (temporal 1.0 mm). (c) AO-SLO image of subject 5 (inferior 0.5 mm). (d) AO-SLO image of subject 4 (inferior 0.5 mm). Presented images of all carriers have several small patch lesions where cones are lost or decreased and residual cone cells appear to be asymmetrical sizes and be of variable shapes. (e, f, g, h) AO-SLO images from an unaffected control at the same location and magnification used for XLRP carriers. The images show normal cone mosaic patterns and no abnormal patch lesions.

