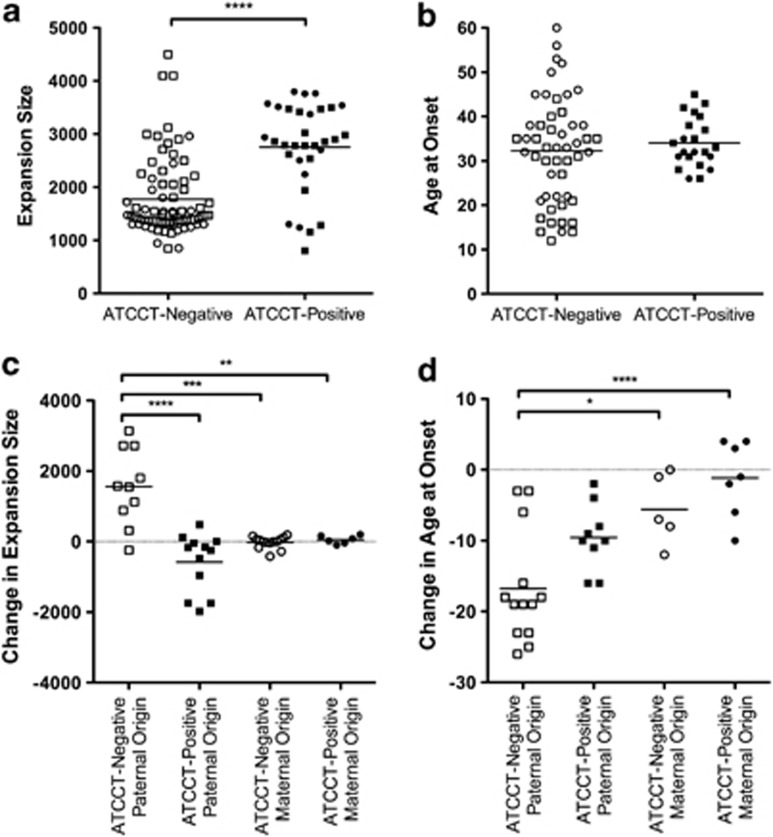
Figure 2.
Effects of ATCCT interruptions on SCA10 expansions and age at onset. (a) Mean SCA10 expansion size in ATCCT-negative alleles (white squares, paternally transmitted, and circles, maternally transmitted) and ATCCT-positive alleles (black squares, paternally transmitted, and circles, maternally transmitted). (b) Mean age at onset, symbols as in panel a. (c) Mean intergenerational change in expansion size as calculated by subtracting the parents' expansion size from that of their childs' in paternally transmitted, ATCCT-negative alleles (white squares), paternally transmitted, ATCCT-positive alleles (black squares), maternally transmitted, ATCCT-negative alleles (white circles) and maternally transmitted, ATCCT-positive alleles (black circles). (d) Mean intergenerational change in age at onset as calculated by subtracting the parent's age at onset from that of their child, symbols as in c. *P<0.05; **P<0.01; ***P<0.001; ****P<0.0001.

