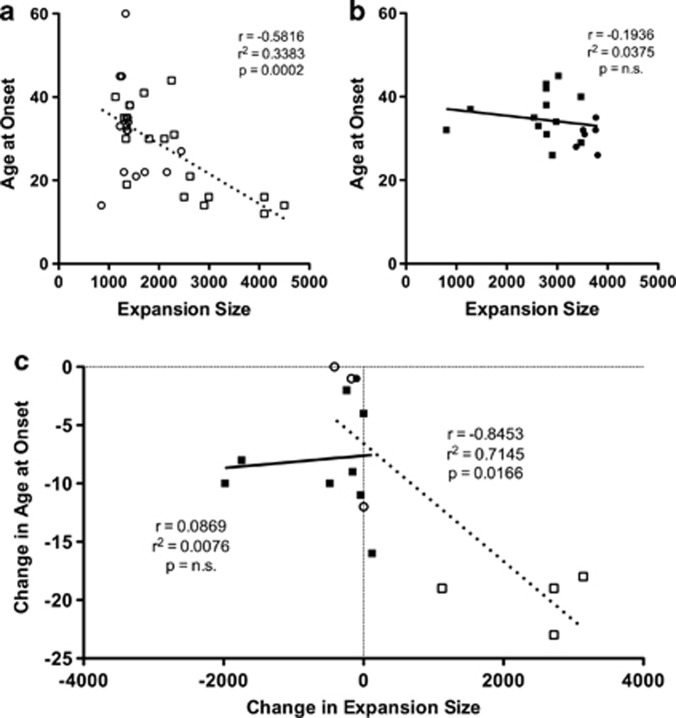
Figure 3.
Effects of ATCCT interruptions on the relationship between expansion size and age at onset and genetic anticipation. (a) Age at onset plotted against expansion size for ATCCT-negative alleles (white circles, maternally transmitted alleles; white squares, paternally transmitted alleles, dashed line). (b) Age at onset plotted against expansion size for ATCCT-positive alleles (black circles, maternally transmitted alleles; black squares, paternally transmitted alleles, solid line). (c) Intergenerational changes in age at onset plotted against intergenerational changes in expansion size, symbols and lines as in panels a and b.

