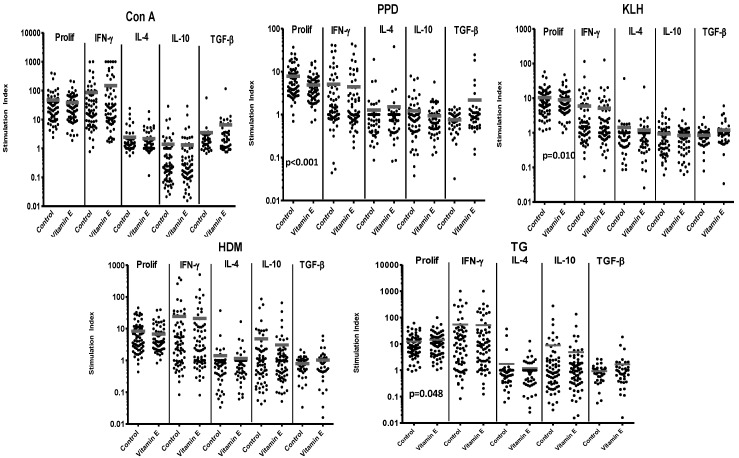
Figure 1.
Responses of 70 cord blood mononuclear cell (CBMC) samples to control stimuli and allergens, with or without supplementation with vitamin E. Responses are expressed as stimulation index. Bars represent mean stimulation indices for each set of culture conditions. Significant p values for differences in responses between paired samples in cultures with or without vitamin E supplementation are shown on the relevant panels.

