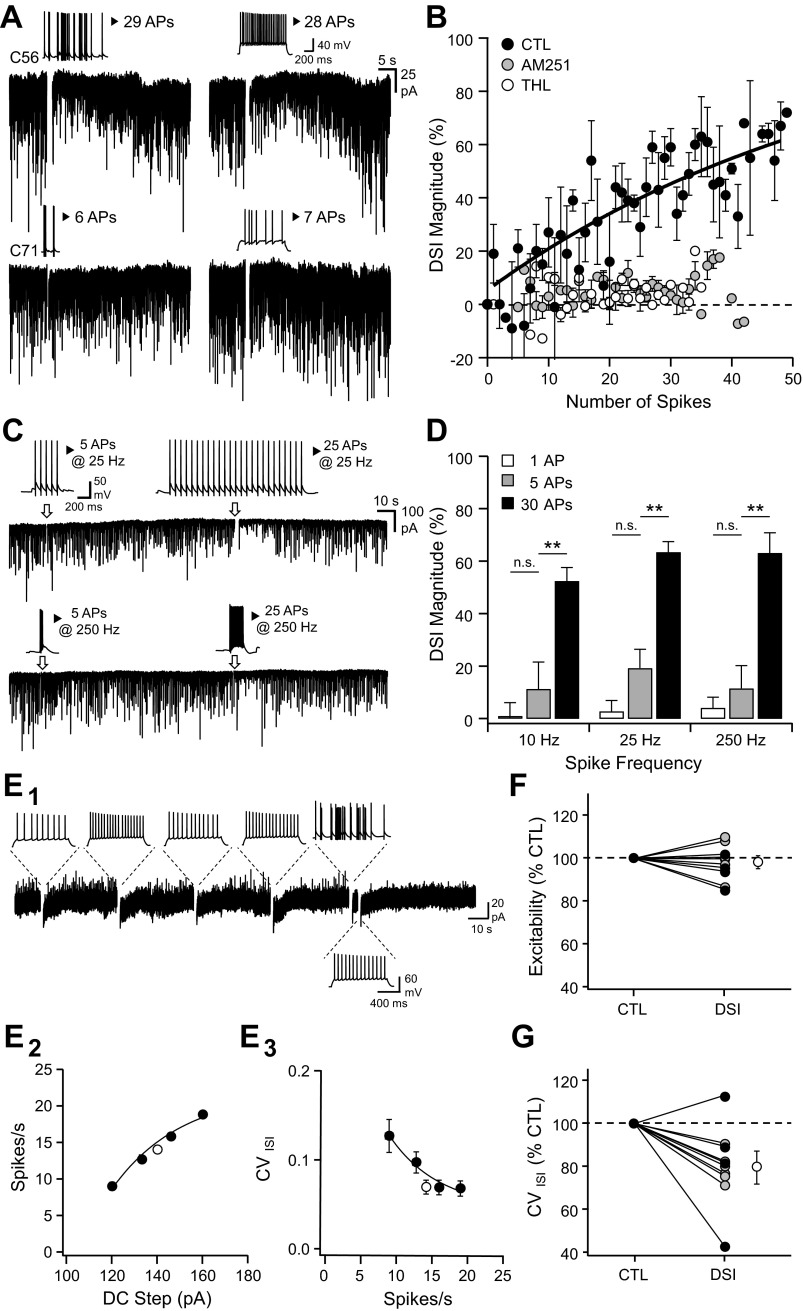
Fig. 2.
Pyramidal cell firing induces endocannabinoid-mediated suppression of GABAergic activity. A: voltage-clamp recordings of spontaneous GABAergic activity (Vhold = −80 mV). After a control period, the cell is transiently switched to current-clamp mode to allow the firing of APs either by a series of brief DC injections to replay a sequence of APs that were recorded in vivo during a single trial in 2 different place cells (top and bottom left, same patterns as in Fig. 1) or a 1-s DC step injection (top and bottom right). B: DSI magnitude as a function of the number of spikes evoked during a 1-s DC step injection in control (black, n = 20) or in the presence of AM251 (5 μM, gray, n = 8) or THL (1 μM, white, n = 3). The average change was measured between 1 and 5 s after the end of neuronal discharge. C: voltage-clamp recordings (Vhold = −80 mV) of spontaneous GABAergic activity interrupted by transient current-clamp switches during which brief DC injections were performed to evoke a series of APs at various rates and durations. Insets represent voltage fluctuations during each paradigm. D: DSI magnitude measured at various spike frequency rates and number of APs. The number of spikes was 1 (white), 5 (gray), or 30 (black). **P < 0.01; n.s., not significant. E1: voltage-clamp recordings of spontaneous GABAergic activity (Vhold = −50 mV) interrupted by episodic current-clamp switches, during which 1-s duration DC injections were performed to evoke a series of APs at various rates (insets). The last but 1 series of APs was evoked at a precise time to replay a place-cell discharge. E2: spike rate vs. DC injection for the cell depicted in E1 and measured for DC injections evoked every 30 s (black) or 5 s after the last DC injection of the series (white). E3: coefficient of variation of the interspike interval (CVISI) vs. spike rate for the cell depicted in A. F: pooled normalized changes in excitability observed during DSI induced by an in vivo spike pattern (n = 4 black circles) or a large DC step (n = 6 gray circles). G: pooled normalized changes in CVISI observed during DSI. The control CVISI was interpolated from the spike rate measured during DSI (n = 4 and 6 as for F).

