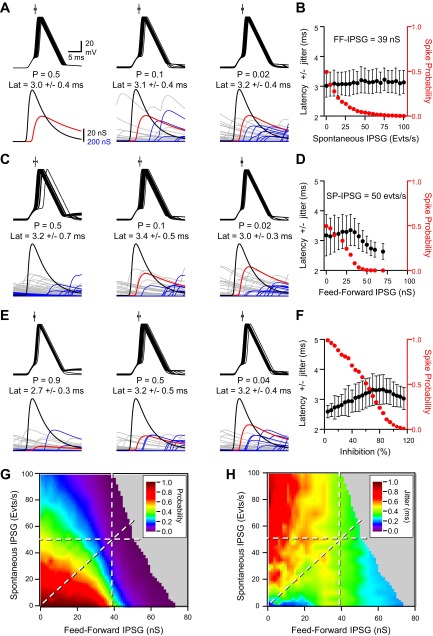
Fig. 7.
Modeling tuning of EPSP-spike coupling by combined spontaneous inhibition and FFI. A, from left to right: superimposed (25) Vm fluctuations in the presence of constant FF-IPSG of 39 nS and various rates of SP-IPSGs (0–30-65 events per second). The EPSG amplitude was set at 80 nS. Only Vm traces where a spike was successfully emitted are displayed. On the top of each group of traces is represented the mean latency ± jitter (n = 250). The EPSP-spike-coupling probability and latency ± jitter are written under Vm. The EPSG is colored in black, FF-IPSG in red, and SP-IPSG fluctuations in blue and gray for spike success and failures, respectively. B: EPSP-spike-coupling probability (red) and latency ± jitter (black) vs. rate of spontaneous GABAergic activity. The EPSG amplitude was set at 80 nS. FF-IPSG was set at 39 nS (n = 250). C: same conditions as in A except that the model received a SP-IPSG rate of 50 events per second and FF-IPSGs of various amplitudes (0-34-44 nS). D: same graph as in B except that the model received an SP-IPSG rate of 50 events per second and FF-IPSGs of various amplitudes (n = 250). E: same conditions as in A except that the model received SP-IPSG rates and FF-IPSGs at constant ratio (7.7 events per second and 6 nS; 28.2 events per second and 22 nS; and 50 events per second and 39 nS for SP-IPSG rate and FF-IPSGs, respectively). F: EPSP-spike-coupling probability (red) and latency ± jitter (black) vs. the percentage of inhibition. One hundred percent inhibition was set when SP-IPSG rate and FF-IPSGs were 50 events per second and 39 nS, respectively. SP-IPSG rates and FF-IPSGs were changed in similar proportions from 0 to 120% of control. G: EPSP-spike-coupling probability displayed on a pseudocolor scale vs. FF-IPSG amplitude and SP-IPSG rates. The horizontal, vertical and diagonal lines correspond to the conditions displayed on A and B, C and D, and E and F, respectively. H: EPSP-spike-coupling jitter displayed on a pseudocolor scale vs. FF-IPSG amplitude and SP-IPSG rates. The horizontal, vertical, and diagonal lines correspond to the conditions displayed on A and B, C and D, and E and F, respectively.

