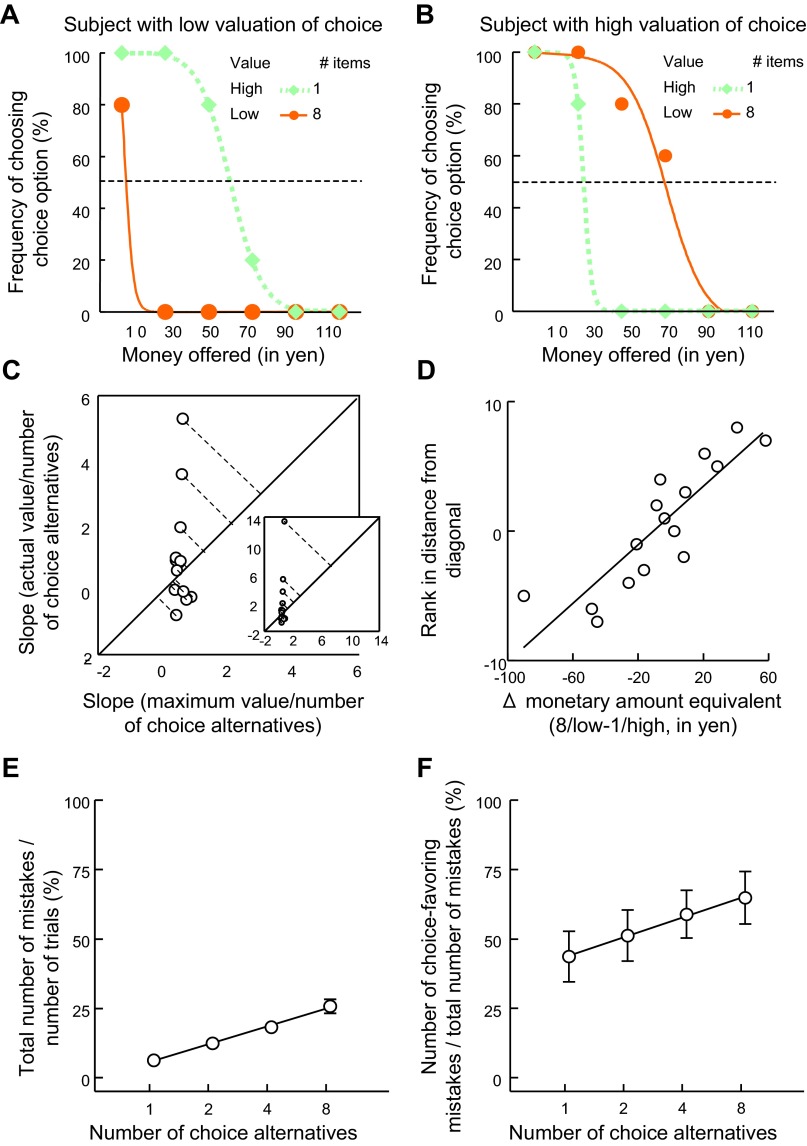
Fig. 3.
Individual differences in preference for choice. A and B: individual preference for choice was measured as subject-specific difference between the monetary amount equivalents in the 8/low-value and the 1/high-value conditions. Positive differences correspond to higher valuation of choice. A: example subject with a low valuation of choice (monetary amount equivalent of 8/low value < 1/high value). B: example subject with a high valuation of choice (monetary amount equivalent of 8/low value > 1/high value). To further support the finding of individual differences in the valuation of choice with respect to 8/low-value vs. 1/high-value conditions, we compared the monetary amounts rejected in the 2 conditions for each subject separately, with higher amounts rejected corresponding to a greater valuation of choice. According to this measure, the example participant shown in B valued the 8/low-value alternative significantly more than the 1/high-value alternative, whereas the example participant shown in A had a significant preference for the 1/high-value alternative. C: individual differences in choice valuation in relation to theoretically possible maximum increase in subjective value from increasing numbers of choice. The slopes of choice-driven monetary amount equivalents as function of the number of choice alternatives are plotted against the slopes of choice-independent maximum preratings as a function of the number of alternatives. One outlier (>9 times second-largest value) is not shown (Grubb's test identified this as an outlier: z = 2.6, P < 0.05). To still include this subject while also preventing the outlier from unduly influencing the correlations, we used ranks of the distance from the diagonal for subsequent analyses (Figs. 3D, 5C, and 5D). The data from 2 other participants are not shown because their indifference value for 1 item was equal to 0 yen, which precluded conversion into rating equivalents. Finally, in the main graph in C, 1 participant is not shown to better illustrate the participants clustering at the bottom of the graph; this participant is shown in the inset. D: relationship between the 2 measures of individual differences. Measures of choice valuation according to A and B are correlated with measures of choice valuation according to C. E: percentage of the number of mistakes relative to the total number of trials as a function of the number of choice alternatives. F: percentage of choice-favoring mistakes relative to the total number of mistakes as a function of the number of choice alternatives. For each subject, choice overvaluation was captured as slope and is related to brain activation in Fig. 5F.

