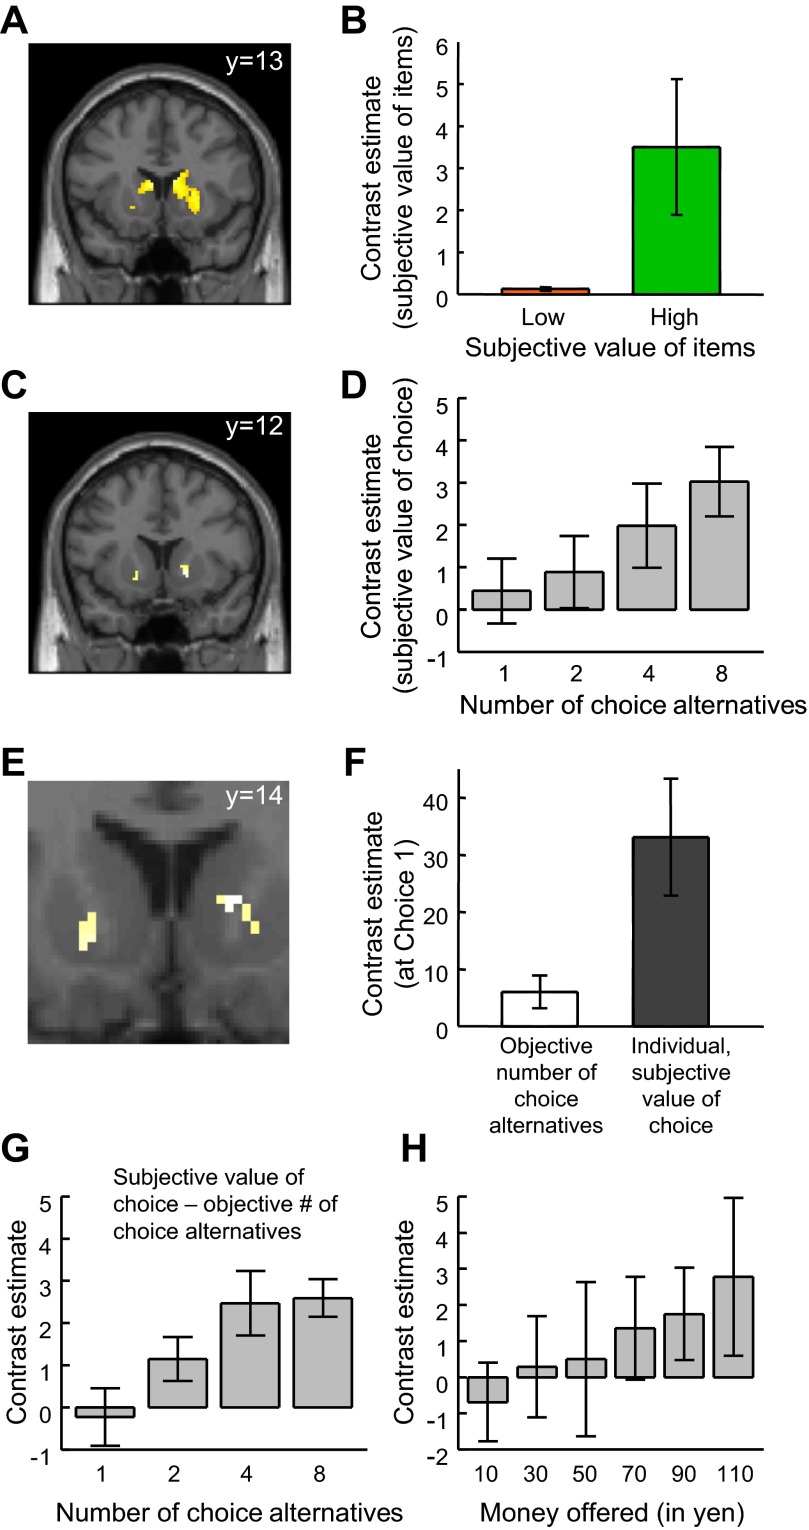
Fig. 4.
Regions coding subjective value of items and of choice at choice 1. A: location in striatum with stronger activation for trials with high- vs. low-value items at time of stimulus presentation in choice 1 (x/y/z: 12/13/−2). Item value was based on attractiveness ratings given by participants before the experiment. [Activation survived small-volume correction irrespective of whether the region of interest (ROI) was defined anatomically or functionally; thus results were the same for the 2 types of ROIs. To show the full extent of the activations, they are displayed at P = 0.005.] B: average effect size in striatal region identified in A. Activation in high-value trials was significantly stronger than in low-value trials (P < 0.05, small-volume correction). C: location in striatum with activation reflecting individual-specific subjective value of choice (x/y/z: 16/12/−2). Subjective value of choice was specified on the basis of monetary amount equivalents determined at choice 1. D: average effect size in striatal region shown in C. Activation increased with subjective value of choice (P < 0.05, small-volume correction). The bar graphs in B and D illustrate the effects of the maps shown in A and C, respectively. E: overlap of activations from A and C, indicating common coding of value of items and value of choice. F: relationship of activation to individualized subjective value of choice was stronger than to objective number of choice alternatives. G: relationship of activation to the number of choice alternatives in striatal voxels, showing better fit with individualized subjective value of choice than with the objective number of choice alternatives (x/y/z: 16/12/18). H: the subset of voxels with common activation to both the value of items and subjective value of choice in E also showed increasing activation with increasing amount of money offered (P < 0.05; x/y/z: 12/16/2). Values are means; error bars represent SE.

