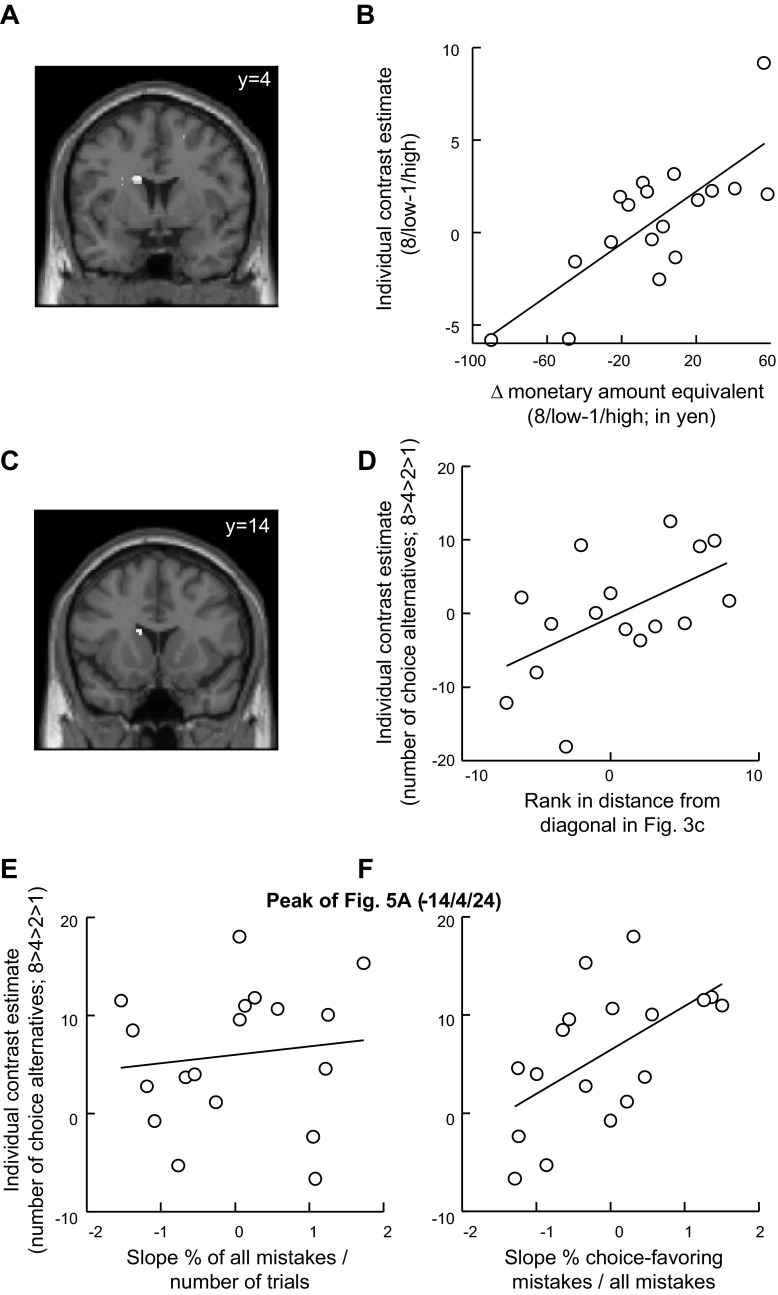
Fig. 5.
Individual differences in brain activation reflecting differences in valuation of choice. A: location in dorsolateral striatum showing correlation between the valuation of 8/low value vs. 1/high value (as determined by monetary amount equivalents) and corresponding brain activation (x/y/z: −14/4/24). B: plot illustrating effect shown in A. C: location in dorsolateral striatum (x/y/z: −12/14/18) at which correlation was found between choice overvaluation (rank data from Fig. 3C) and activation related to number of choice alternatives (8 > 4 > 2 > 1). D: plot illustrating effect shown in C. E: absence of relationship between dorsolateral striatal activation and individual tendency to make mistakes overall. At the peak location identified in A, plot shows activation related to the number of choice alternatives (8 > 4 > 2 > 1) as a function of individual slopes in mistakes from different numbers of choices. F: relationship between dorsolateral striatal activation and tendency to make choice-favoring mistakes as the number of choice alternatives increases. At the same location that was plotted in E, activation related to number of choice alternatives (8 > 4 > 2 > 1) increased with the tendency to make choice-favoring mistakes. Thus the more often subjects mistakenly chose the choice option, the more dorsolateral striatal activation increased with the number of choice alternatives.

