
Fig. 2.
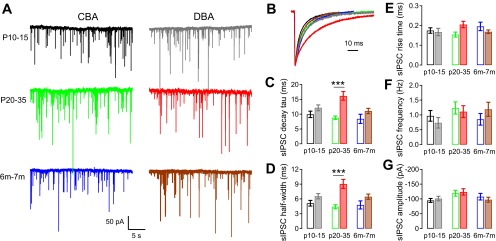
Spontaneous inhibitory postsynaptic currents (sIPSCs) in bushy cells from CBA/CaJ and DBA/2J mice. A: example traces of sIPSCs in bushy cells from CBA/CaJ and DBA/2J mice at different age groups. The color code indicates strain and age (CBA: black P10–15, green P20–35, and blue 6–7 mo; DBA: gray P10–15, red P20–35, and brown 6–7 mo), and also applies to panels B–G, as well as to Figs. 3, 4, and 6. B: kinetics of the averaged sIPSCs from cells in A. Traces were normalized to the peak to allow comparison of the time course. Note the slow decay of sIPSCs in P20–35 DBA/2J mice compared with other ages and to CBA/CaJ mice. C–G: summaries of weighted decay time constant (τ) for averaged sIPSCs (C), sIPSC half-width (D), sIPSC 20–80% rise time (E), sIPSC frequency (F), and sIPSC average amplitude (G) for all bushy cells in each group. Values and number of cells are also summarized in Table 1. Open bars: CBA/CaJ mice; filled bars: DBA/2J mice. ***Bonferroni-corrected posttest after two-way ANOVA: P < 0.001.