Fig. 5.
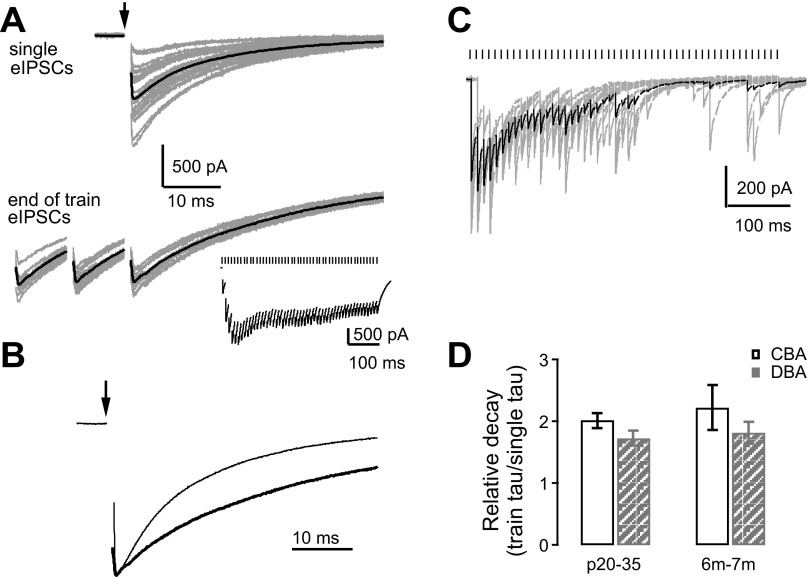
eIPSC kinetics become slower during repeated stimulation in both CBA/CaJ and DBA/2J mice. A: example traces of single eIPSCs (top) and last three eIPSCs of 50 pulse trains at 100 Hz (bottom) obtained from a bushy cell of a P22 DBA/2J mouse. Inset in the bottom panel shows an averaged trace for the 100-Hz train. Ticks on top mark the time of the 50 stimuli during the train. Stimulus artifacts are removed. B: comparison of IPSC traces between single eIPSC (thin trace) and last eIPSC of the 100-Hz 50 pulse train (thick trace). Traces are normalized to the peak of the IPSCs. C: example IPSCs in a bushy cell from a CBA mouse at P10. In the majority of the trials, excitatory postsynaptic currents could not be elicited during the second half of the stimulus train. Black trace: the average IPSC of all 12 trials. D: ratio of eIPSC decay τ (last eIPSC/single eIPSC) for 100-Hz trains. Ratios were computed for individual cells.

