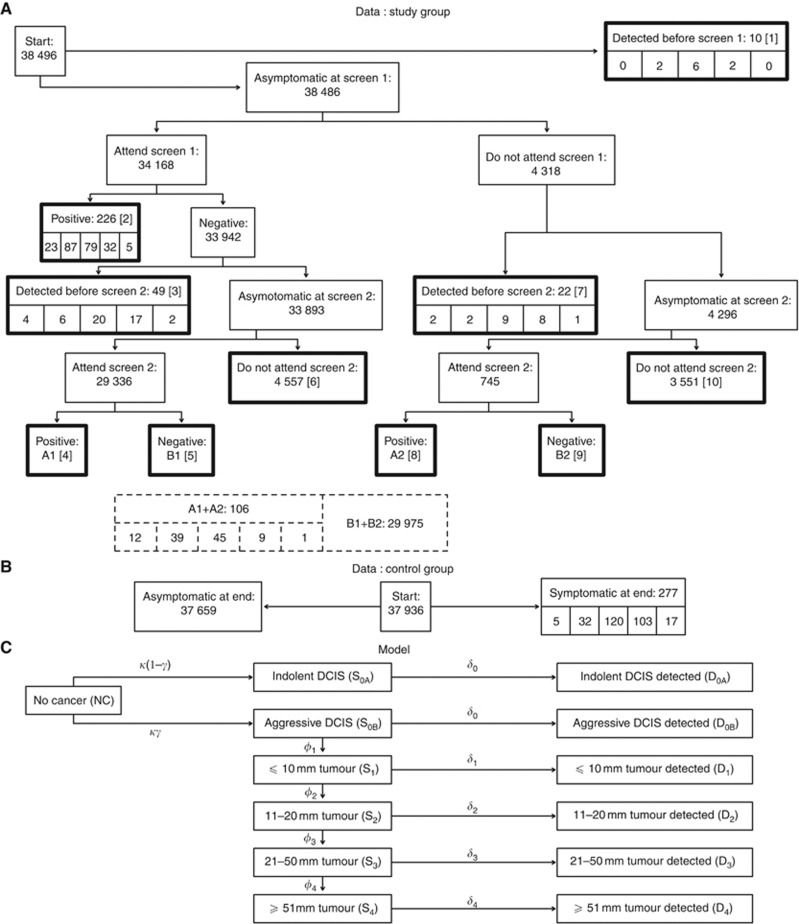
Figure 1.
Flow diagrams of the data used in the study and 13-state Markov model in the absence of screening. (A) Ten outcomes are marked in thickly bordered rectangles with tumour sizes, in order DCIS, ⩽10, 11–20, 21–50 and ⩾51 mm, underneath. Data were extracted from tables and text of Fagerberg et al (1985). The publication did not distinguish screening results at the second screen by attendance at the first screen: the merged data are provided in the dashed rectangles at the foot. (B) Asymptomatic and symptomatic controls at end of the study, with data for each tumour size group given underneath. (C) Greek letters indicate transition rates from one state to another. The detection states are absorbing: once a woman enters those, she goes for treatment and does not progress within this model.

