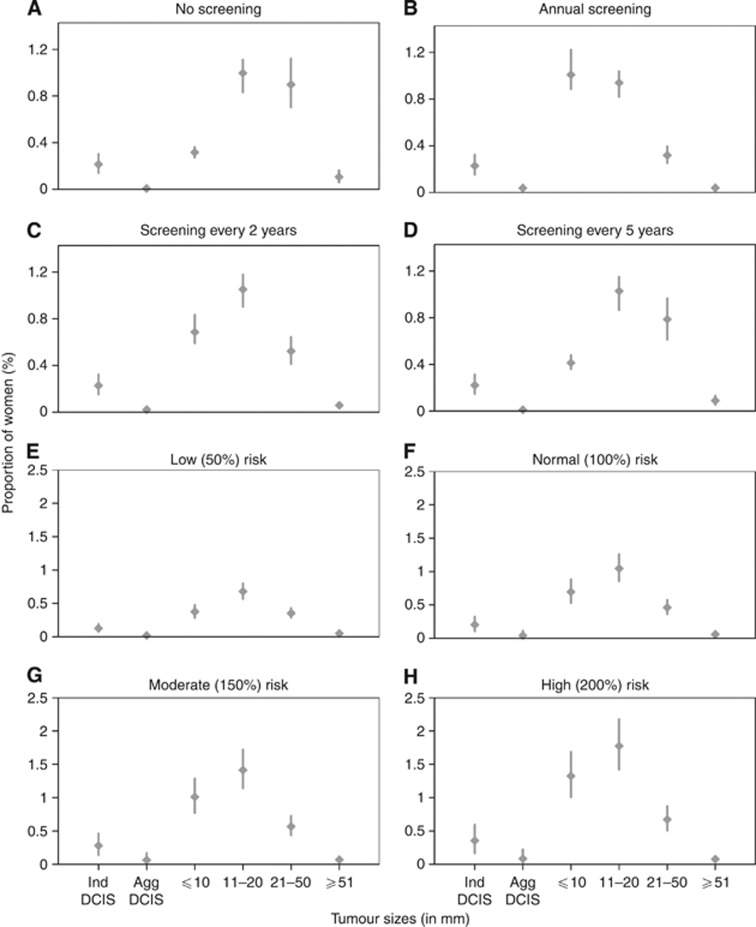
Figure 3.
Tumour size distribution for different mammographic screening frequencies and different rates from no cancer to DCIS, based on 13-state model. Different mammographic screening frequencies – (A) no screening, (B) annual screening, (C) screening every 2 years, and (D) screening every 5 years. Different rates from no cancer to DCIS – (E) low risk, (F) normal risk, (G) moderate risk, and (H) high risk.

