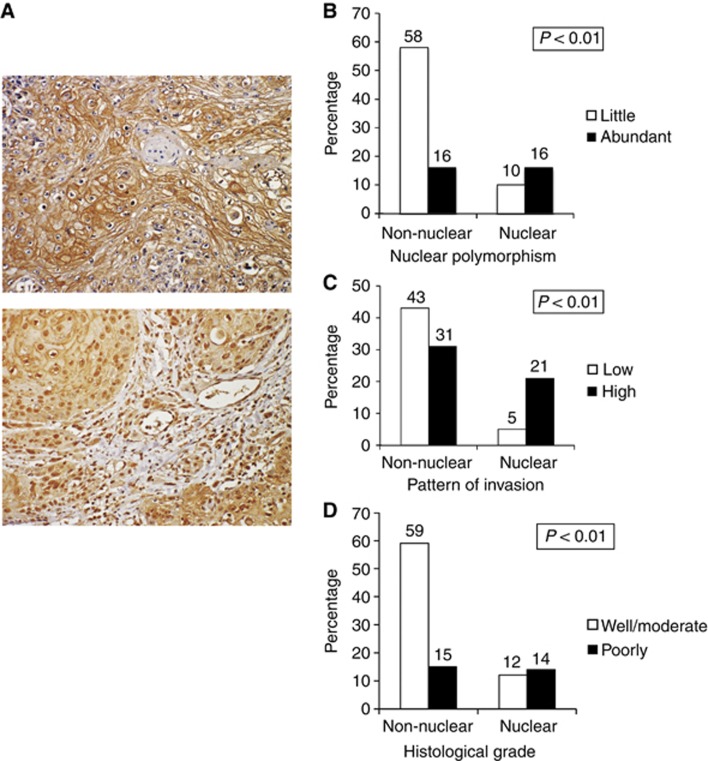
Figure 2.
Expression of nuclear FGFR1 and its correlation with clinicopathological findings in HNSCC. (A) Positive expression pattern of FGFR1 at higher magnification ( × 200). The upper panel shows positive expression of FGFR1 in the membrane and cytoplasm of cancer cells. The lower panel shows positive expression of FGFR1 in the nuclei of cancer cells. (B) Correlation between FGFR1 expression in the nucleus and nuclear polymorphism (little and abundant). The graph shows the percentage of cases with nuclear or non-nuclear expression of FGFR1 in each group (high or low nuclear polymorphism). (C) Correlation between FGFR1 expression and the pattern of invasion (low grade and high grade). The graph shows the percentage of cases with nuclear or non-nuclear expression of FGFR-1 in each group (high- or low-grade invasive pattern). (D) Correlation between nuclear FGFR1 expression and the histopathological grade (well, moderate or poorly differentiated). The graph shows the percentage of cases with nuclear or non-nuclear expression of FGFR1 in each group (well and moderate or poorly expressed for each histopathological grade).

