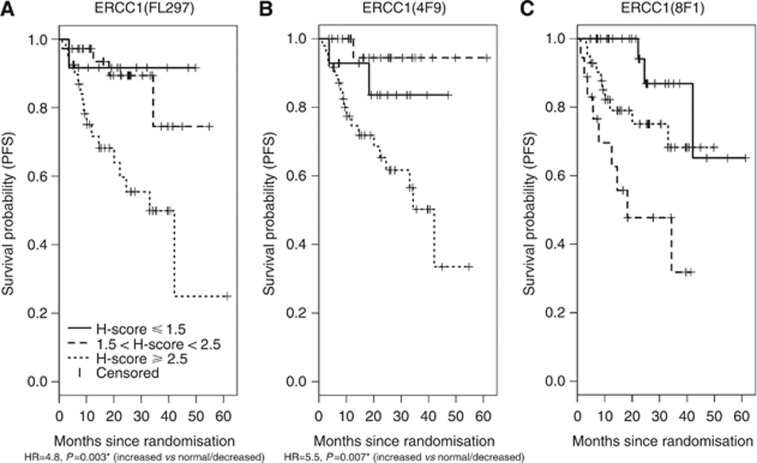
Figure 4.
(A–C) Kaplan–Meier curves showing PFS as a function of categorical ERCC1. For the primary analysis, PFS was treated as a continuous variable. For purposes of graphical display, PFS is presented in Figure 4 for each antibody, according to pre-defined categories of ERCC1 expression: increased (H-score ⩾2.5), normal (1.5< H-score <2.5), or decreased (H-score ⩽1.5). Hazard ratios are presented for the exploratory cutpoint, ‘increased' vs ‘normal/decreased' ERCC1 expression as detected by the two specific antibodies. * Indicates statistical significance.

