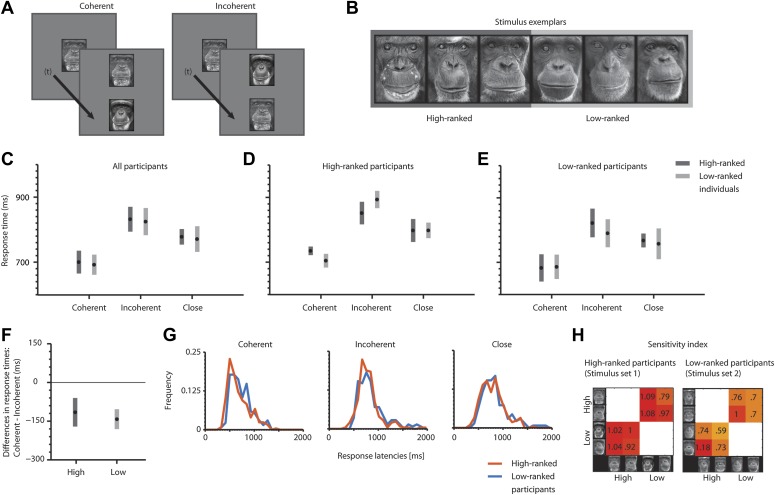
Figure 1. Task sequence, example stimuli and response latency analyses.
(A) Typical trial sequence. (B) Stimulus exemplars. (C) Average response latencies for coherent, incoherent and close trials (mean ± SEM) for all participants, (D) for high-ranked participants and (E) for low-ranked participants. (F) Average response latency differences (coherent–incoherent) for high and low positions. (C, F) The number of independent data points (N) is six for each condition. (G) Normalized frequency distribution of response latencies of high- and low-ranked participants for coherent, incoherent and close trials. (H) Sensitivity index for both stimulus sets and stimuli. Positive values indicate facilitation for coherent relative to incoherent trials.

