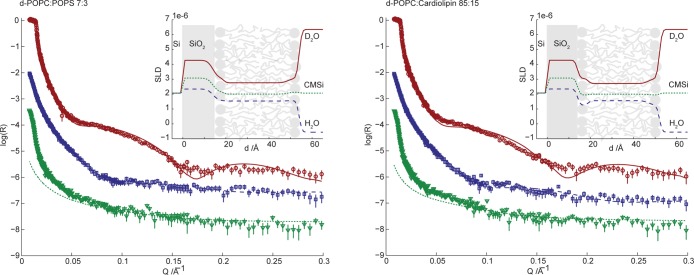
Figure 4.
Neutron reflectivity (plotted as log10R) as a function of momentum transfer (Q) for surface-deposited 7:3 d-POPC/POPS (left) and 85:15 d-POPC/CL (right) phospholipid bilayers. The lines correspond to the fit of the multilayer models presented in Table 1 (fitting parameters in Table S1 of the Supporting Information). The reflectivity was measured for three degrees of solvent deuteration: D2O (red circles, top curve), CMSi (green triangles, bottom curve), and H2O (blue squares, middle curve). The deviation at low Q for CMSi originates from the instrumental setup and was disregarded during the modeling. Data in CMSi and H2O are offset in log(R) by −2 and −1, respectively, for the sake of clarity. The insets show the resulting SLD profiles as a function of distance from the silicon substrate.

