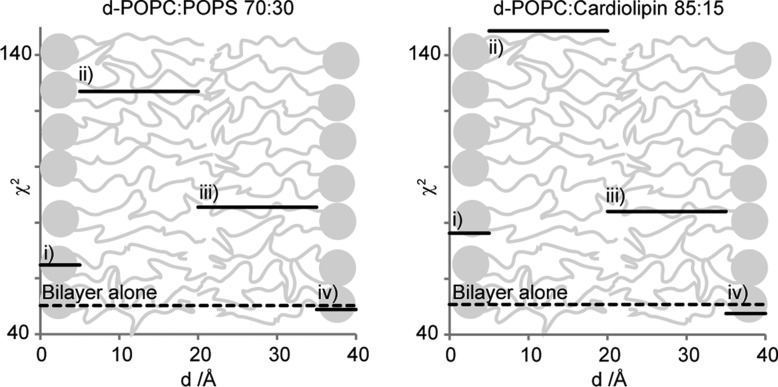
Figure 6.
Weighted sum of squared residuals (χ2) produced from data collected before and after addition of protein to surface-deposited phospholipid bilayers. To test four possible protein positions in the bilayer [(i) inner headgroup region, (ii) inner acyl chain region, (iii) outer acyl chain region, and (iv) outer headgroup region], the solvent content of one layer at a time is decreased by 10% of the total volume at the same time as the SLD value of that same layer is increased to values corresponding to the presence of 10% protein. The χ2 from the fit when positioning the protein in a layer is plotted constant throughout the layer as the SLD in the layer is assumed to be constant. The dashed lines are χ2 values from applying the unperturbed bilayer models (Figure 4) on data collected after addition of protein (Figure 5).

