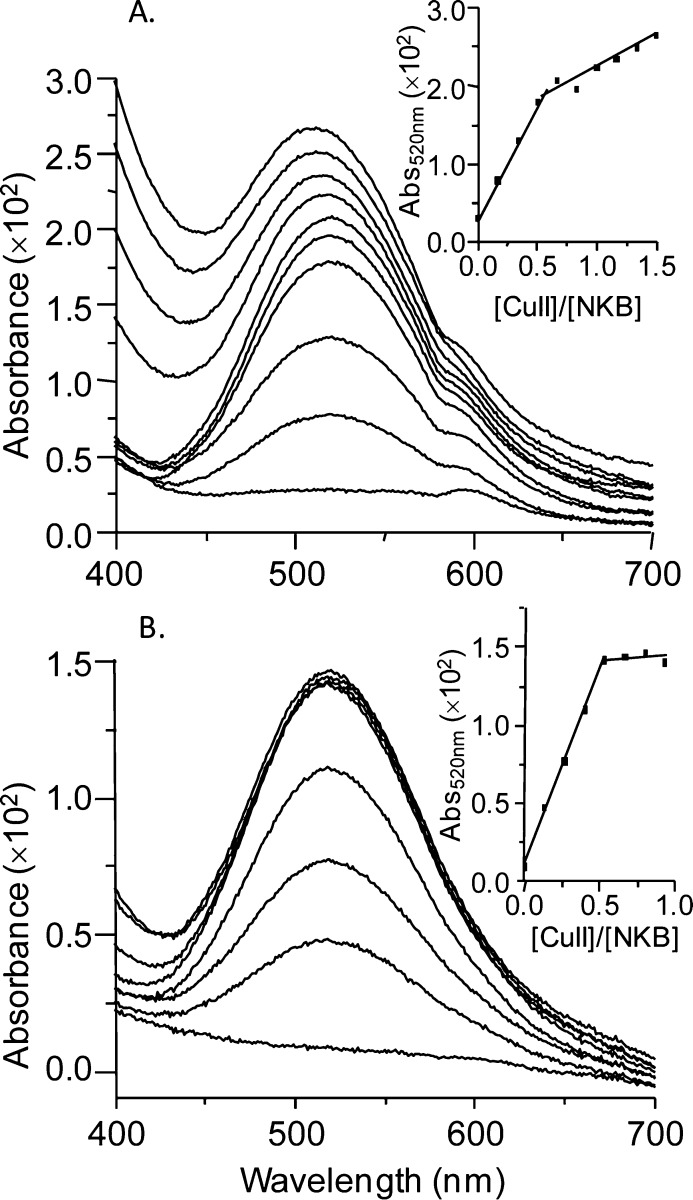
Figure 2.
CuII binding titrations of NKB monitored by UV/vis spectroscopy. (A) NKB (108.5 μM) prepared in 30 mM SDS, 10 mM nEM, pH 7.9, was titrated with CuCl2 and the absorbance in the visible region (400–700 nm) was monitored. (B) Copper titration of NKB (108.5 μM) prepared in 30 mM SDS, 10 mM nEM, pH 8.9. Insets show the absorbance at 520 nm plotted as a function of copper equivalents added ([CuII]/[NKB]), revealing a plateau in the binding curve at 0.5 equiv at both pH values.

