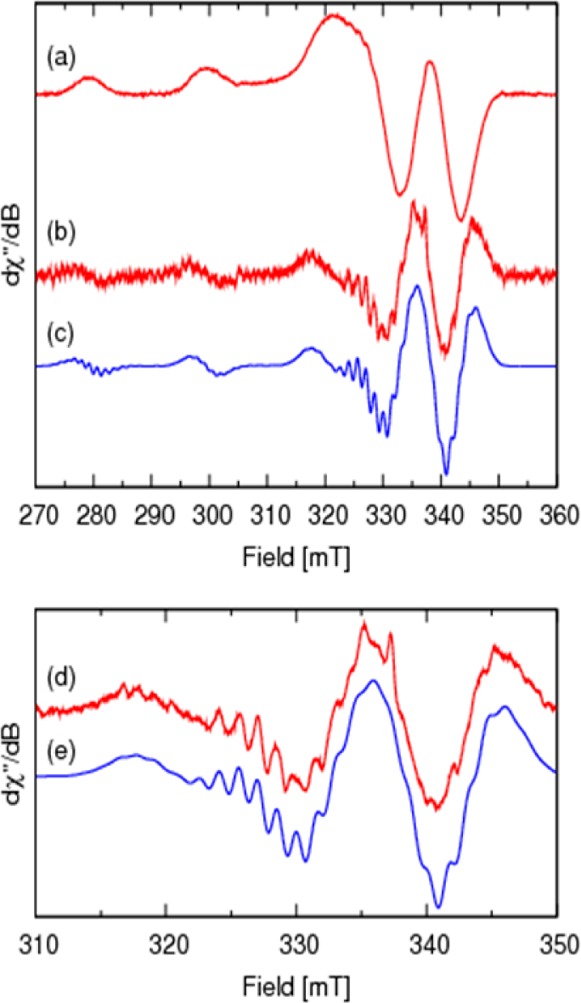
Figure 5.

X-band (ν = 9.441882) EPR spectra of [CuII(NKB)2] in 30 mM SDS, 10 mM n-EM, pH 7.9, measured at 140 K: (a) first derivative spectrum; (b) second derivative Fourier filtered spectrum; (c) computer simulation, see Table 1 and Table S1, Supporting Information, for spin Hamiltonian and line width parameters; (d,e) expansion of the perpendicular region of spectra b and c, respectively revealing the nitrogen superhyperfine coupling.
