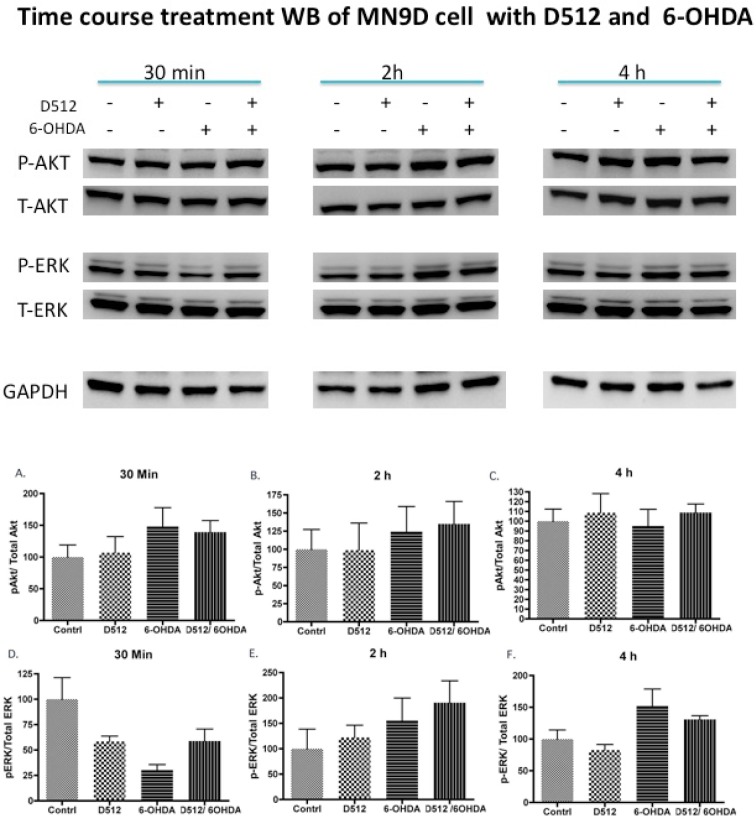
Figure 10.
Determination of the activities of ERK and Akt by Western blot analysis. MN9D cells were pretreated with 10 μM D512 for 1 h followed by cotreatment with 75 μM 6-OHDA separately for 0.25, 2, and 4 h. GAPDH was used as an internal control protein. For quantification purposes, the protein level was normalized with respect to either the total Akt or ERK proteins. The values shown are the mean ± SD of three independent experiments performed in triplicate. One-way ANOVA analysis followed by Tukey’s multiple comparison posthoc test was performed.

