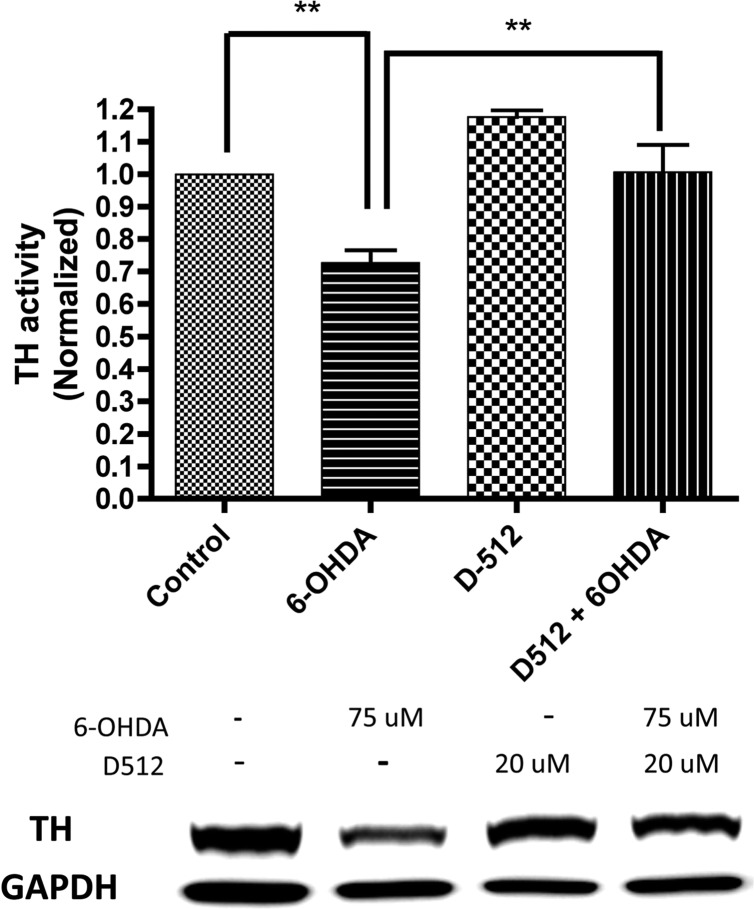
Figure 9.
TH protein level was determined by Western blot analysis. MN9D cells were pretreated with 20 μM D-512 for 1 h and co-treated with 75 μM 6-OHDA for 24 h. MN9D cells were also treated with control vehicle, D-512 and 6-OHDA alone. For quantification purpose protein level was normalized with respect to GAPDH protein. The values shown are means ± SDs of three independent experiments performed in triplicate. One way ANOVA analysis followed by Tukey’s Multiple Comparison post hoc test were performed. (**p < 0.05 control compared to the 6-OHDA group. **p < 0.05 6-OHDA compared to the D512 + 6OHDA group).

