Figure 3.
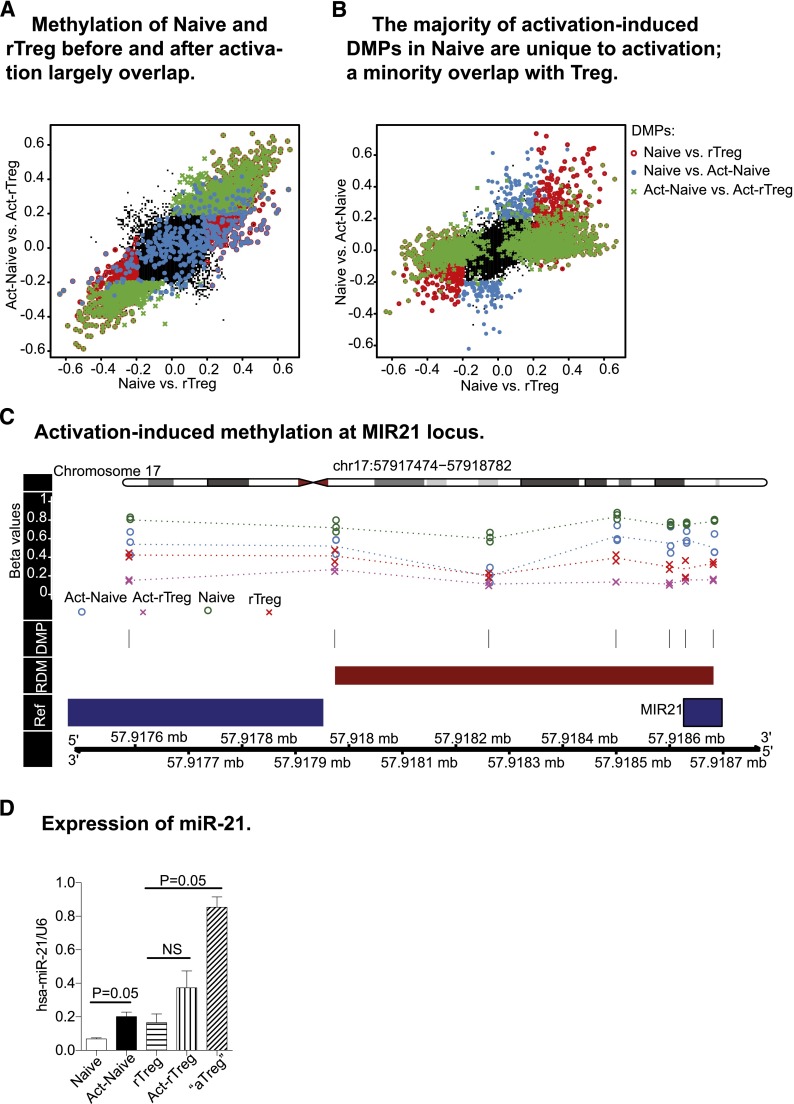
Activation-induced changes in DNA methylation profiles. (A) Act-Naive and Act-rTreg displayed significant differences in 1679 CpG probes (green cross), the majority of which overlapped with the differences found between these 2 T-cell subsets before activation (red circle). The distinct DNA methylation profiles between Naive and rTreg are largely unaffected by activation. (B) Activation-induced methylation changes in 466 CpGs in Naive CD4+T cells (blue dots). Of these, 171 overlapped with the methylation patterns of rTreg and 283 were unique to activation. (C) Activation-induced demethylation at the MIR21 locus. (D) Expression of miR-21 in Naive and Treg before and after activation. Data are represented as mean ± standard error of the mean of 3 donors. *P = .05 (Mann–Whitney test, 1-tailed).

