Figure 1.
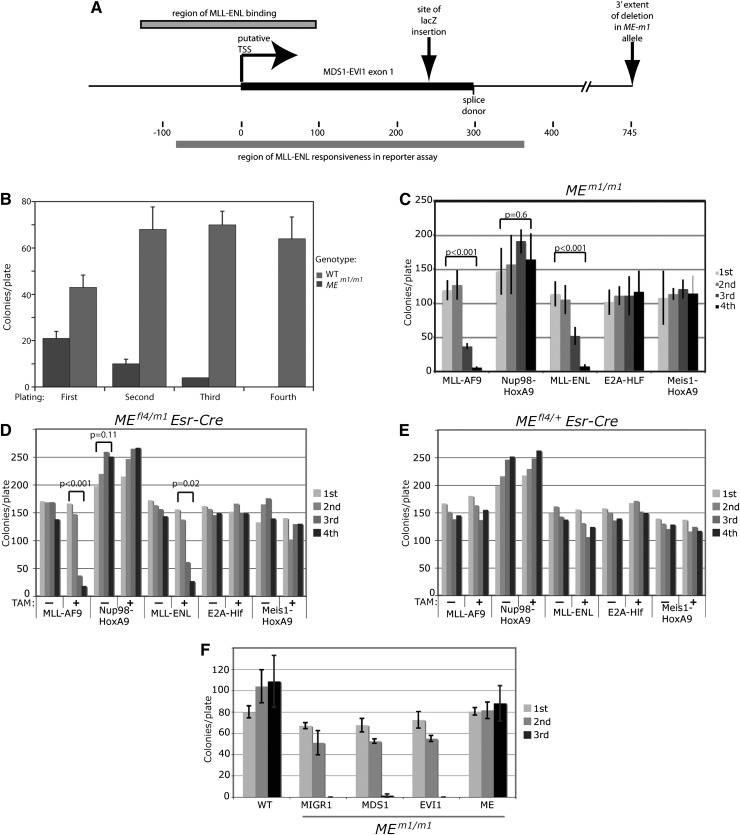
MEm1/m1 bone marrow is resistant to MLL-AF9–induced transformation. (A) Diagram of the MEm1 allele, showing exon 1 of Mds1, with putative transcription start site and splice donor site, as well as site of lacZ insertion and the extent of the DNA of the first intron deleted. Also shown are the locations of MFP binding described by Arai et al,5 as well as the MFP-responsive region identified by this same group by luciferase reporter assays.5 (B) Quantitation of number of colonies formed in growth factor–supplemented methylcellulose at each of 4 replatings, for WT and MEm1/m1 bone marrow. Error bars represent standard deviation of platings done in triplicate, 1000 cells per plate. The experiment was repeated multiple times with the same result. (C-E) ME requirement is restricted to transformation by MLL fusion genes. (C) Quantitation of number of colonies formed in growth factor–supplemented methylcellulose at each of 4 replatings for MEm1/m1 LSK cells transduced with the virus indicated. Error bars are standard deviation; P values were determined by Student t test, comparing the first and fourth platings. (D-E) Serial replating assay of bone marrow from mice of the genotype indicated, transduced with the leukemogenic oncogene indicated, and treated or not with 4-OH TAM (1 µM) as indicated. Error bars are not shown but are within 10% of the value of each bar; P values were calculated by Student t test, comparing first and fourth platings. (F) ME but not EVI1 or MDS1 can rescue the transformation deficiency of MEm1/m1 bone marrow. Serial replating transformation assay of LSK cells isolated from either WT or MEm1/m1 bone marrow, transduced with MLL-AF9, as well as retroviral expression construct indicated: MIGR1 (empty vector), MDS1, EVI1, or ME. Error bars denote standard deviation. Third replating yielded no colonies for MIGR1- and EVI1-transduced cells.

