
Figure 1.
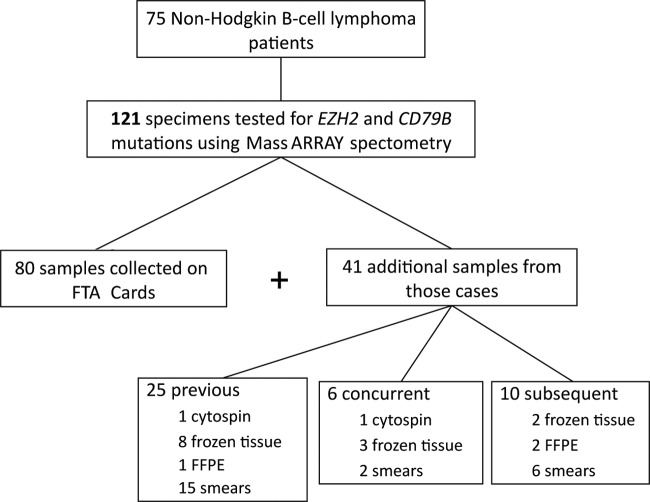
Flow chart shows the total number of samples and patients enrolled in the study, as well as the types of specimens used and their connection to the samples collected on the FTA cards.
Official websites use .gov
A
.gov website belongs to an official
government organization in the United States.
Secure .gov websites use HTTPS
A lock (
) or https:// means you've safely
connected to the .gov website. Share sensitive
information only on official, secure websites.
Flow chart shows the total number of samples and patients enrolled in the study, as well as the types of specimens used and their connection to the samples collected on the FTA cards.