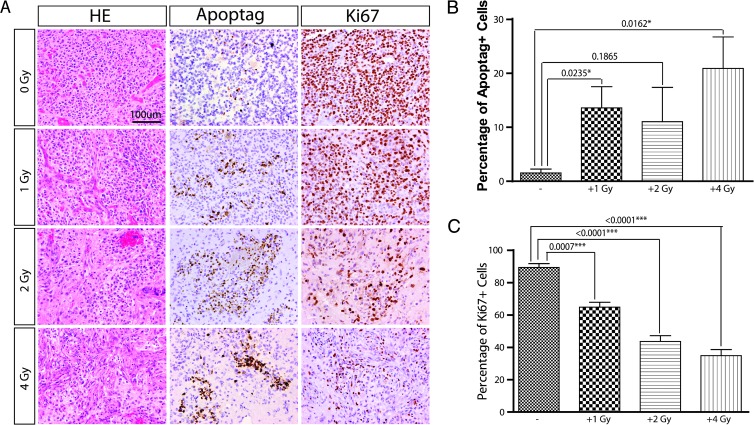
Figure 4.
Dose-dependent response of IR treatment. (A) Representative images showing the proliferation and apoptosis of tumor cells under different dose of IR treatment. (B) The percentage of apoptotic cells (ApopTag+) was quantified (40x area) among different doses of IR treatments (mice of each group: n = 3). (C) The percentage of proliferative cells (Ki-67+) were quantified (40x area) among different doses of IR treatments (mice of each group: n = 3). Data are presented as the means ± SEM.

