Figure 1.
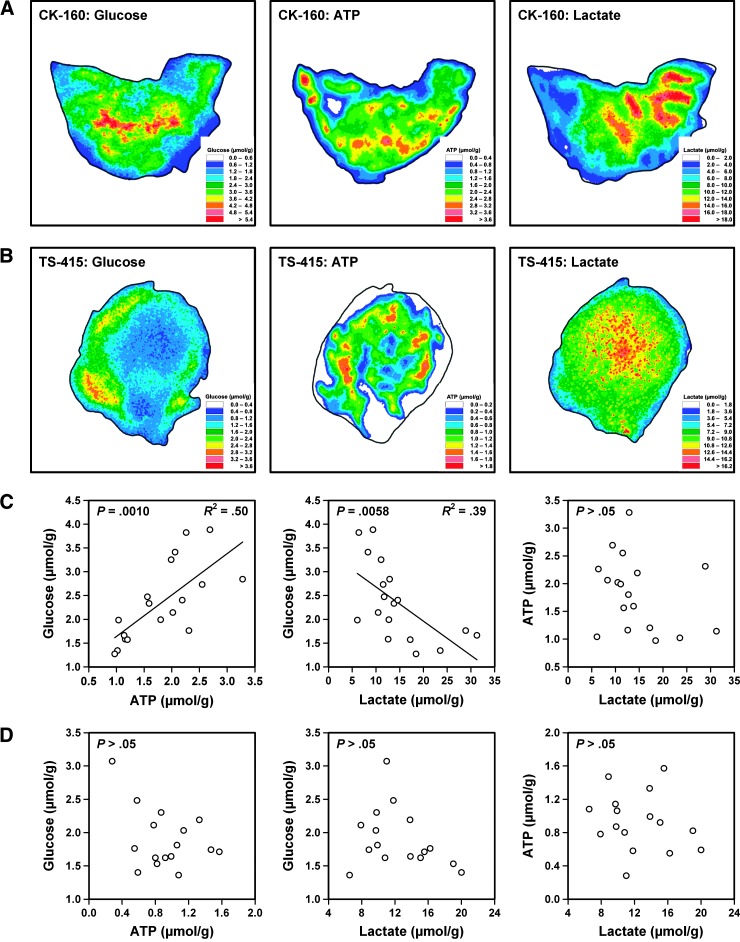
Glucose, ATP, and lactate concentration images of a representative CK-160 tumor (A) and a representative TS-415 tumor (B) as measured by imBI and plots of glucose concentration versus ATP concentration, glucose concentration versus lactate concentration, and ATP concentration versus lactate concentration for CK-160 (C) and TS-415 (D) tumors. Points represent single tumors. Curves were fitted to data by linear regression analysis.

