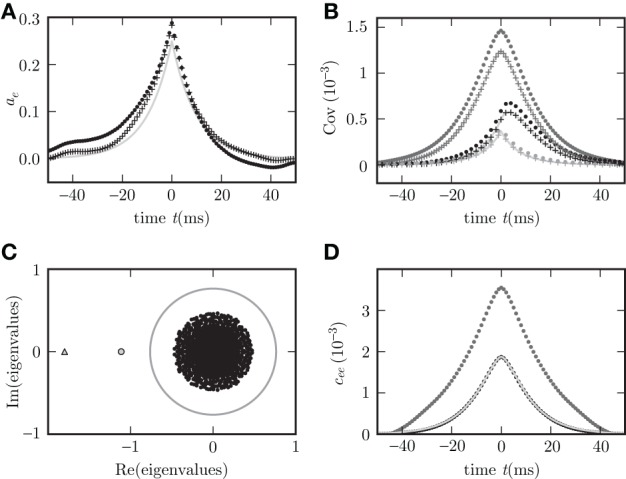
Figure 3.

Limits of the theory for fixed in-degree and fixed out-degree. Autocovariance (A) and covariance (B) in random networks with fixed in-degree (dots) and fixed out-degree (crosses). Simulation results for c
 , c
, c
 , and c
 are shown in dark gray, black and light gray, respectively for synaptic weight w = 0.011 far from bifurcation. For larger synaptic weight w = 0.018 close to bifurcation (see text at the end of “Population-averaged covariances”), c
 is also shown in (D) for fixed in-degree (dark gray dots) and for fixed out-degree (black dots). Corresponding theoretical predictions for the autocovariance (34) (A) and the covariance (18) (B,D) are plotted as light gray curves throughout. The set of eigenvalues is shown as black dots in panel (C) for the smaller weight. The gray circle denotes the spectral radius (Rajan and Abbott, 2006; Kriener et al., 2008) confining the set of eigenvalues for the larger weight. The small filled gray circle and the triangle show the effective eigenvalues L of the averaged systems for small and large weight, respectively.
