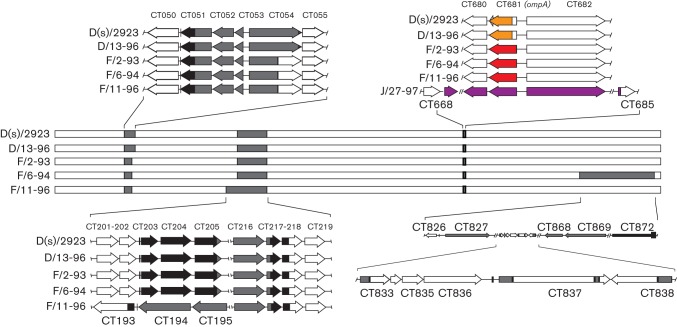
Fig. 4.
Genome maps of clinical isolates examined in this study. Each horizontal bar represents the complete genome sequence of the indicated strain or specimen, beginning with CT001. Sequence origin was identified by plotting informative sites using rip. Regions coloured grey indicate areas of apparent recombination that, in some strains, have margins that indicate independent recombination events. Black regions indicate conserved sequence between informative sites of sequences of different origin. The region showing the expanded sequences surrounding CT681 contains colour-coded sequence that identifies the ompA sequence origin (red, F; yellow, D; purple, J). J/27-97 is included in the ompA comparisons because the sequences shown were solved to a high degree of confidence, while the overall genome structure contained a relatively high level of ambiguous bases.

