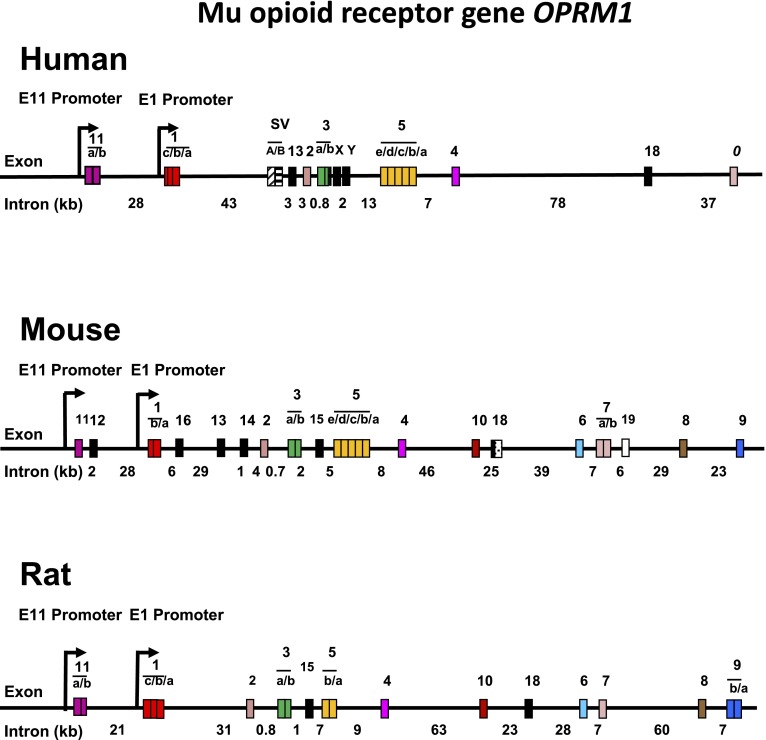
Fig. 15.
Schematic of human, mouse and rat OPRM1. A schematic representation of the OPRM1 gene in humans, mice, and rats is shown. The exon and intron distances are not drawn to scale. Exons and introns are shown as boxes and horizontal lines, respectively. Intron sizes are indicated as kilobases (kb). The exon and intron distances are not drawn to scale. Promoters are indicated by arrows. Exons are numbered based upon the published data (Pan and Pasternak, 2011).

