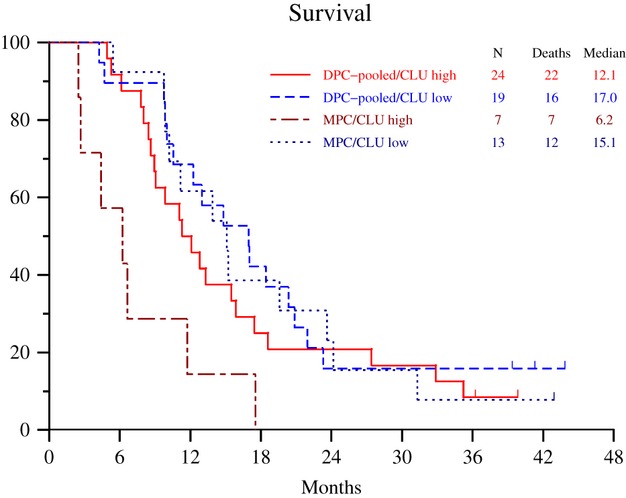
Figure 5.

Kaplan–Meier estimates of survival by treatment group. The proportional hazard regression modeling (Table 2) suggested that Kaplan–Meier estimates from the four subgroups shown are a good representation of the data. In particular note that the difference between high versus low CLU response applies regardless of the type of chemotherapy.
